

OTP Analytics
Learn how to read the OTP Analytics dashboard in TextPeak: delivery and conversion rates, failure reasons, failover rescue, and fraud signals.
OTP Analytics is the TextPeak dashboard for verification performance. It reports how many one-time passwords (OTP) you requested, how many were delivered and verified, where delivery is failing, how much of that failure the failover chain recovers, and which traffic patterns look like abuse.
NOTEOTP Analytics reports on the configurations you set up under OTP Service. If you have not created one yet, see Creating OTP Configurations.
Opening OTP analytics
To open the OTP Service > OTP Analytics page:
-
Log in to TextPeak in your browser.
-
Click OTP Service in the main menu on the left, then click Analytics.
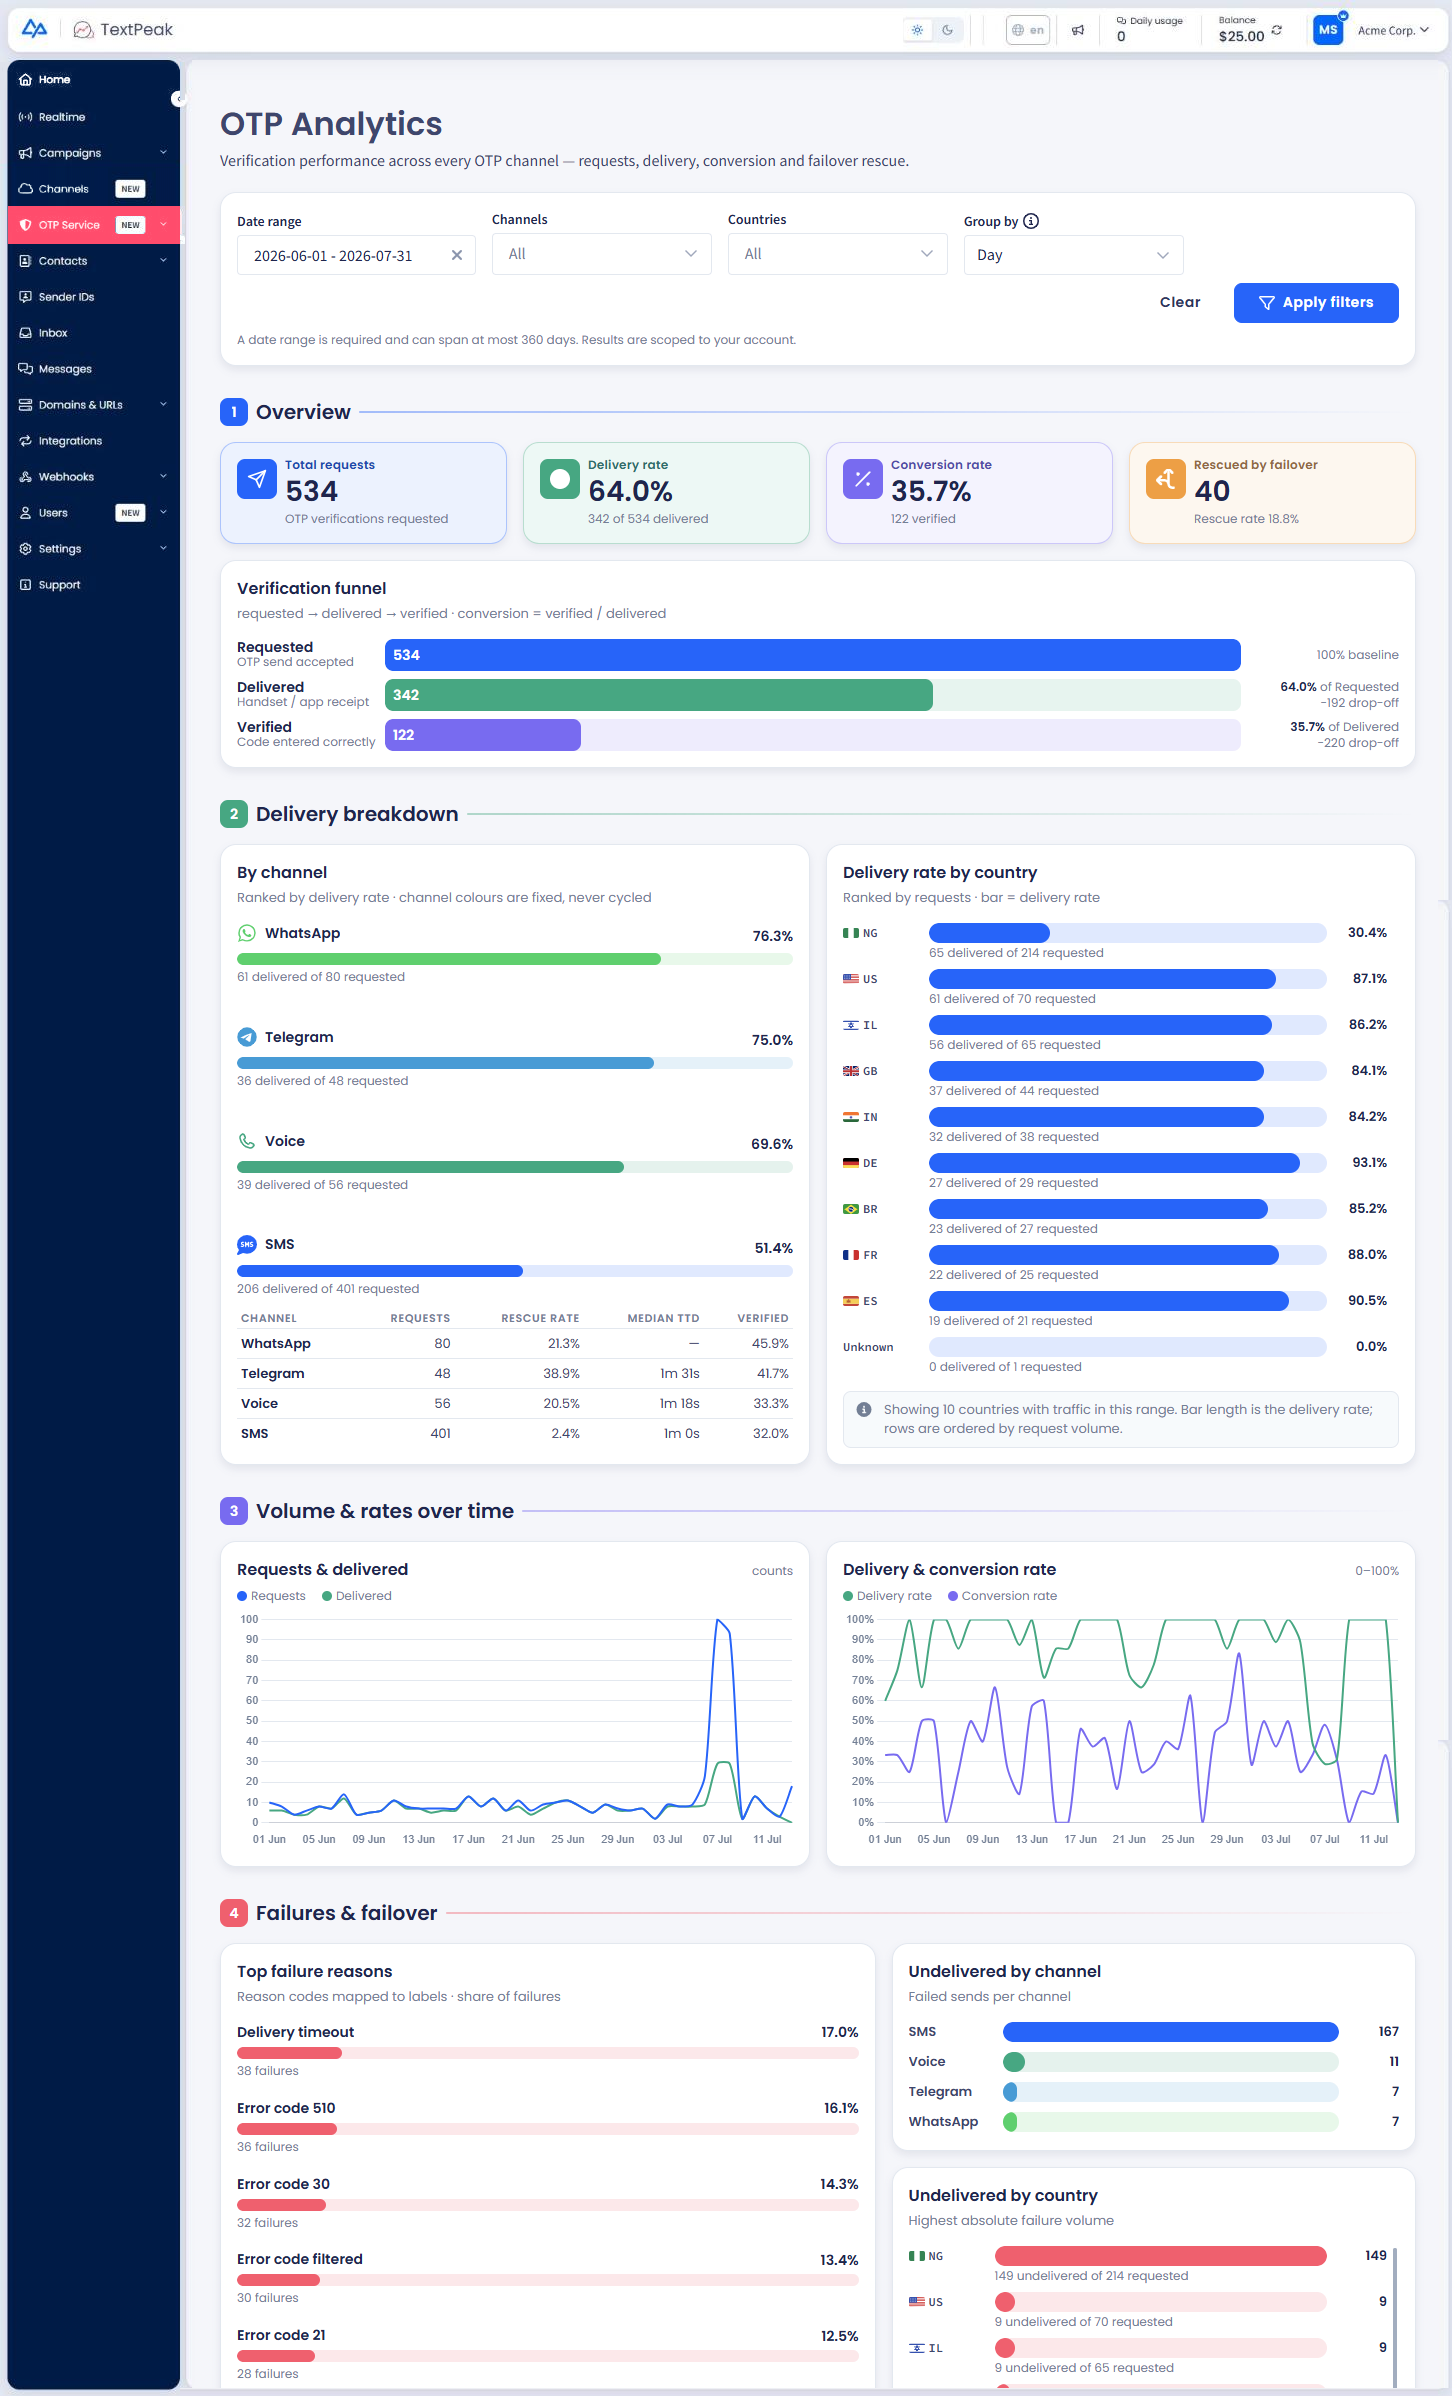
The OTP Analytics page and its filter bar
Filtering the dashboard
The filter bar at the top of the page scopes every panel below it.
| Option | Description |
|---|---|
| Date range | Required. The period to report on. A range can span at most 360 days. |
| Channels | Limits the report to selected channels. Defaults to All. |
| Countries | Limits the report to selected destination countries. Defaults to All. |
| Group by | The bucket size for the time-series panels. Defaults to Day. |
Set the options you want, then click Apply filters. Click Clear to return to the defaults. Results are scoped to your account.
Overview counters
The dashboard is divided into five numbered sections.
Section 1, Overview, holds three counters for the selected range.
| Counter | What it reports |
|---|---|
| Total requests | One-time passwords requested in the range. |
| Delivery rate | The share of those requests that were delivered, with the raw figures underneath. |
| Rescued by failover | Requests that a fallback channel delivered after the first channel failed, with the rescue rate underneath. |
NOTEConversion counts verified codes, so it only applies if you verify the code through the OTP API as well as sending it. A request counts as converted when the recipient submits the code and TextPeak confirms it.
Delivery breakdown
- By channel ranks the channels by delivery rate, then repeats them in a table with CHANNEL, REQUESTS, RESCUE RATE, and MEDIAN TTD (median time to delivery) columns. Channel colours are fixed rather than cycled, so a channel keeps the same colour between reports.
- Delivery rate by country ranks destination countries by request volume. The length of each bar is that country's delivery rate.
Use this pair to spot a channel or a destination that performs worse than the rest before you change the order of the failover chain.
Volume and rates over time
Requests & delivered plots requests against delivered messages over the range, in the buckets set by Group by. Use it to separate a genuine change in demand from a change in delivery quality.
Failures and failover
- Top failure reasons maps reason codes to labels and shows each one's share of total failures.
- Undelivered by channel counts failed sends per channel.
- Undelivered by country ranks countries by absolute failure volume.
- Failover rescue shows how many first-attempt failures the fallback channels recovered, and how many stayed undelivered.
TIPRead Failover rescue together with the order of your failover chain. If one channel recovers most of the failures, moving it earlier in the chain shortens the path to delivery. Weigh that against what each channel costs you per message.
Fraud signals
Three panels that flag traffic worth a second look.
| Panel | What it flags |
|---|---|
| Volume spikes | Buckets whose volume exceeds three times the trailing 7-day baseline. Only spiking buckets are listed. |
| Destination concentration | Single destinations that account for more than 20% of requests. Numbers are masked. |
| At-risk countries | Countries with a failure rate above 50% and at least 50 requests in the range. |
IMPORTANTThese panels are for visibility only. Nothing on this page blocks traffic. A panel with no signal is good news, not an error.
An at-risk country matters more for OTP than for marketing traffic: a recipient who never receives the code cannot sign in, deposit, or complete a purchase. When a country appears here, review the channel chain for that destination or contact CommPeak support about the route.
Empty panels
A panel with nothing to report says so in place of its chart: No rescue transitions in this range, No volume spikes in this range, or No at-risk countries in this range. That means the filters returned no matching traffic, not that the report failed. Widen the date range or reset the channel and country filters, then apply again.
For the log behind these figures, see OTP Request Log.
Updated 7 days ago