Dashboard
Get familiar with the PBX Stats dashboard, your account's homepage, which provides a summary of key statistics such as call volumes, durations, and agent performance, along with interactive graphs and charts.
The Dashboard is the homepage of your PBX Stats account. Here you can see the main statistics of your Classic PBX for the selected period (today by default).
The statistics include:
-
Total number of inbound and outbound calls
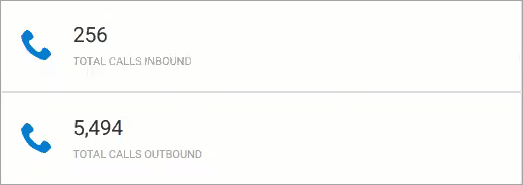
Total number of inbound and outbound calls
NOTEThe refresh interval for today’s total outbound calls is up to five minutes.
-
ACD, the average duration of inbound and outbound calls
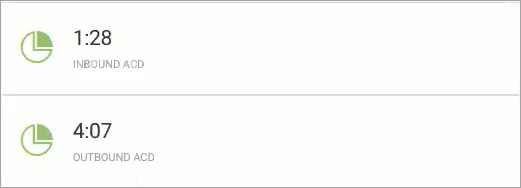
Average duration of inbound and outbound calls
-
The percentage of bridged calls (connected inbound calls) and successful outbound calls
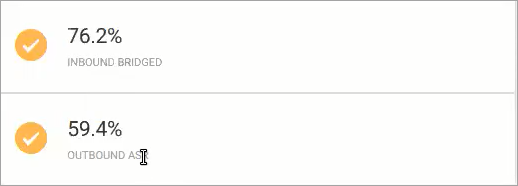
Percentage of bridged inbound calls and successful outbound calls
-
Bridged and non-bridged inbound calls

Bridged and non-bridged inbound call statistics
-
Answered and unanswered outbound calls
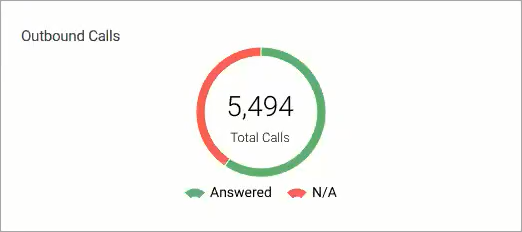
Answered and unanswered outbound call statistics
-
Inbound and outbound call statistics graph
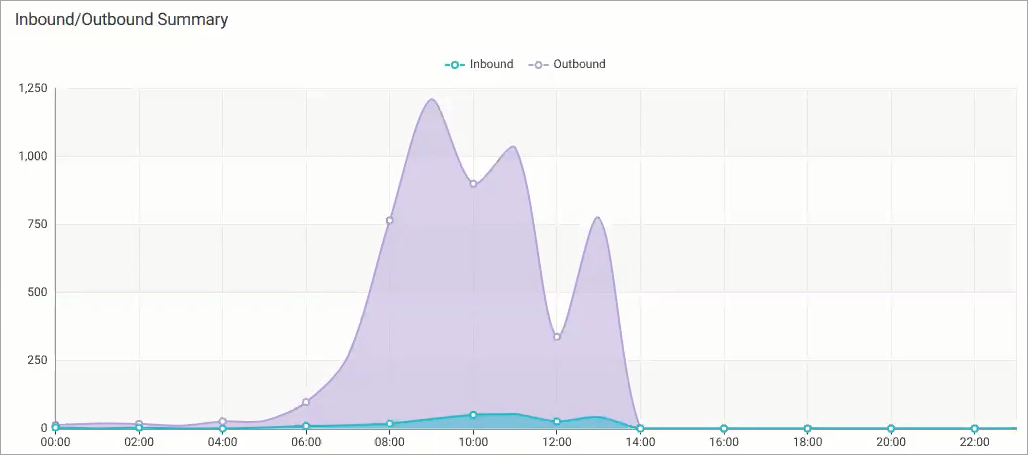
Inbound and outbound call statistics graph
-
The list of top five agents. By default, it shows the most successful agents by the number of calls made. To sort the results by a different criterion, click the header of the respective column.
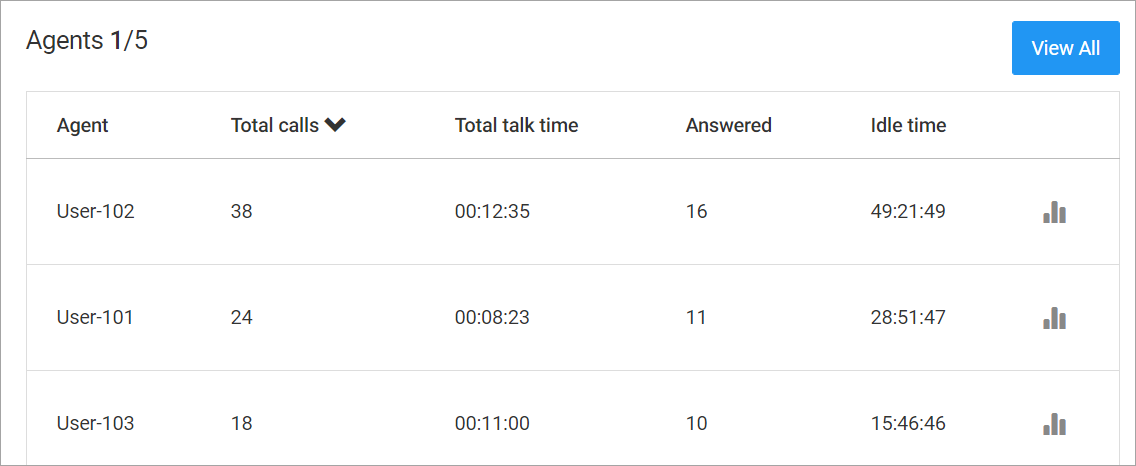
Top five agents list
-
Call duration graph
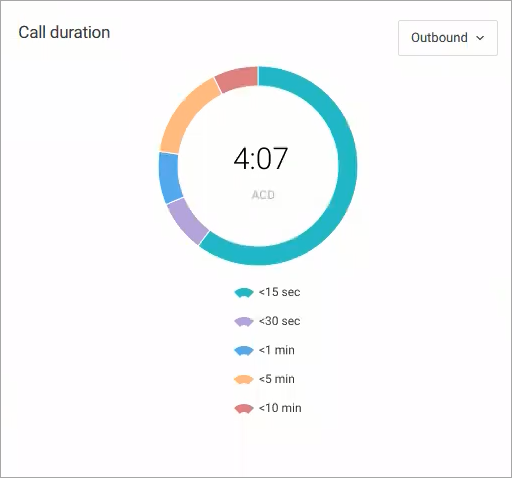
Call duration graph
-
Queue summary graph
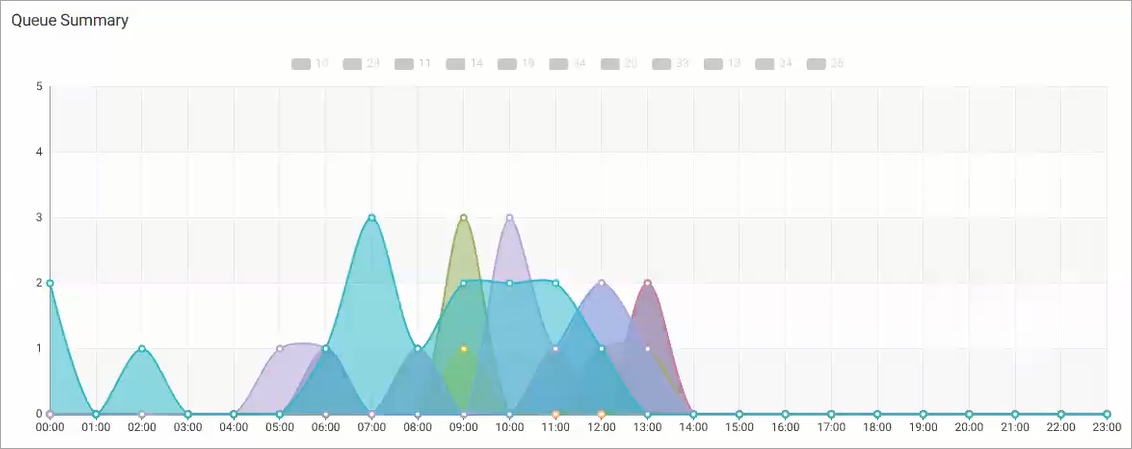
Queue summary graph
-
SLA box - the percentage of inbound calls answered within one minute.
Percentage of inbound calls answered within one minute
Updated 6 months ago