Network Monitor Pinger
Сheck your connection quality with Network Monitor - Pinger: measure latency and packet loss between CommPeak servers and your IP address, helping you identify issues on either side.
Use Network Monitor - Pinger to monitor Network Latency and Packet Loss between your IP addresses and CommPeak servers so you can isolate connectivity bottlenecks on either end.
In the CommPeak Portal, go to Help and Support in the main menu and click the Network Monitor - Pinger tab.
Network Monitor in the main menu
Network monitoring page
Adding a New IP
You can add a new IP to Monitoring as follows:
-
Click the Add Host to Monitor button at the top right.
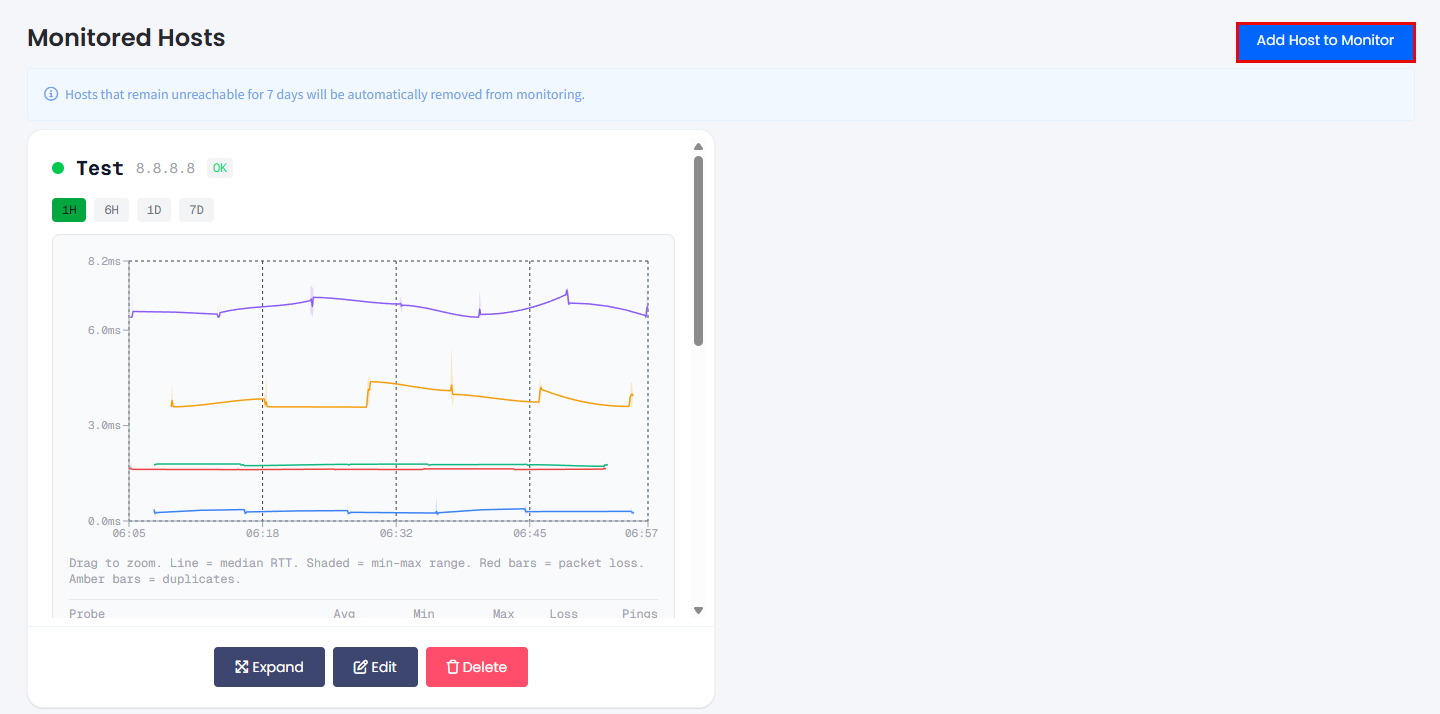
Adding a new IP for monitoring
-
In the pop-up window, fill out the fields as follows:
-
In the Host IP (IPv4) field, specify the IP address you want to monitor.
-
Optionally, enter the name for the IP address in the Description field.
-
Select CommPeak's regions to monitor your IP from.
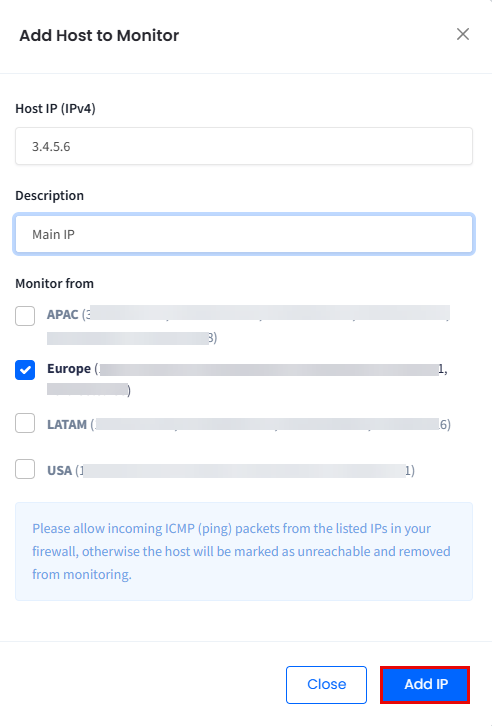
Adding a new IP - settings
-
-
Click Add IP.
IMPORTANTTo be able to use the network monitor, you should allow ICMP echo requests and replies between the IPs of the selected CommPeak servers and your IP.
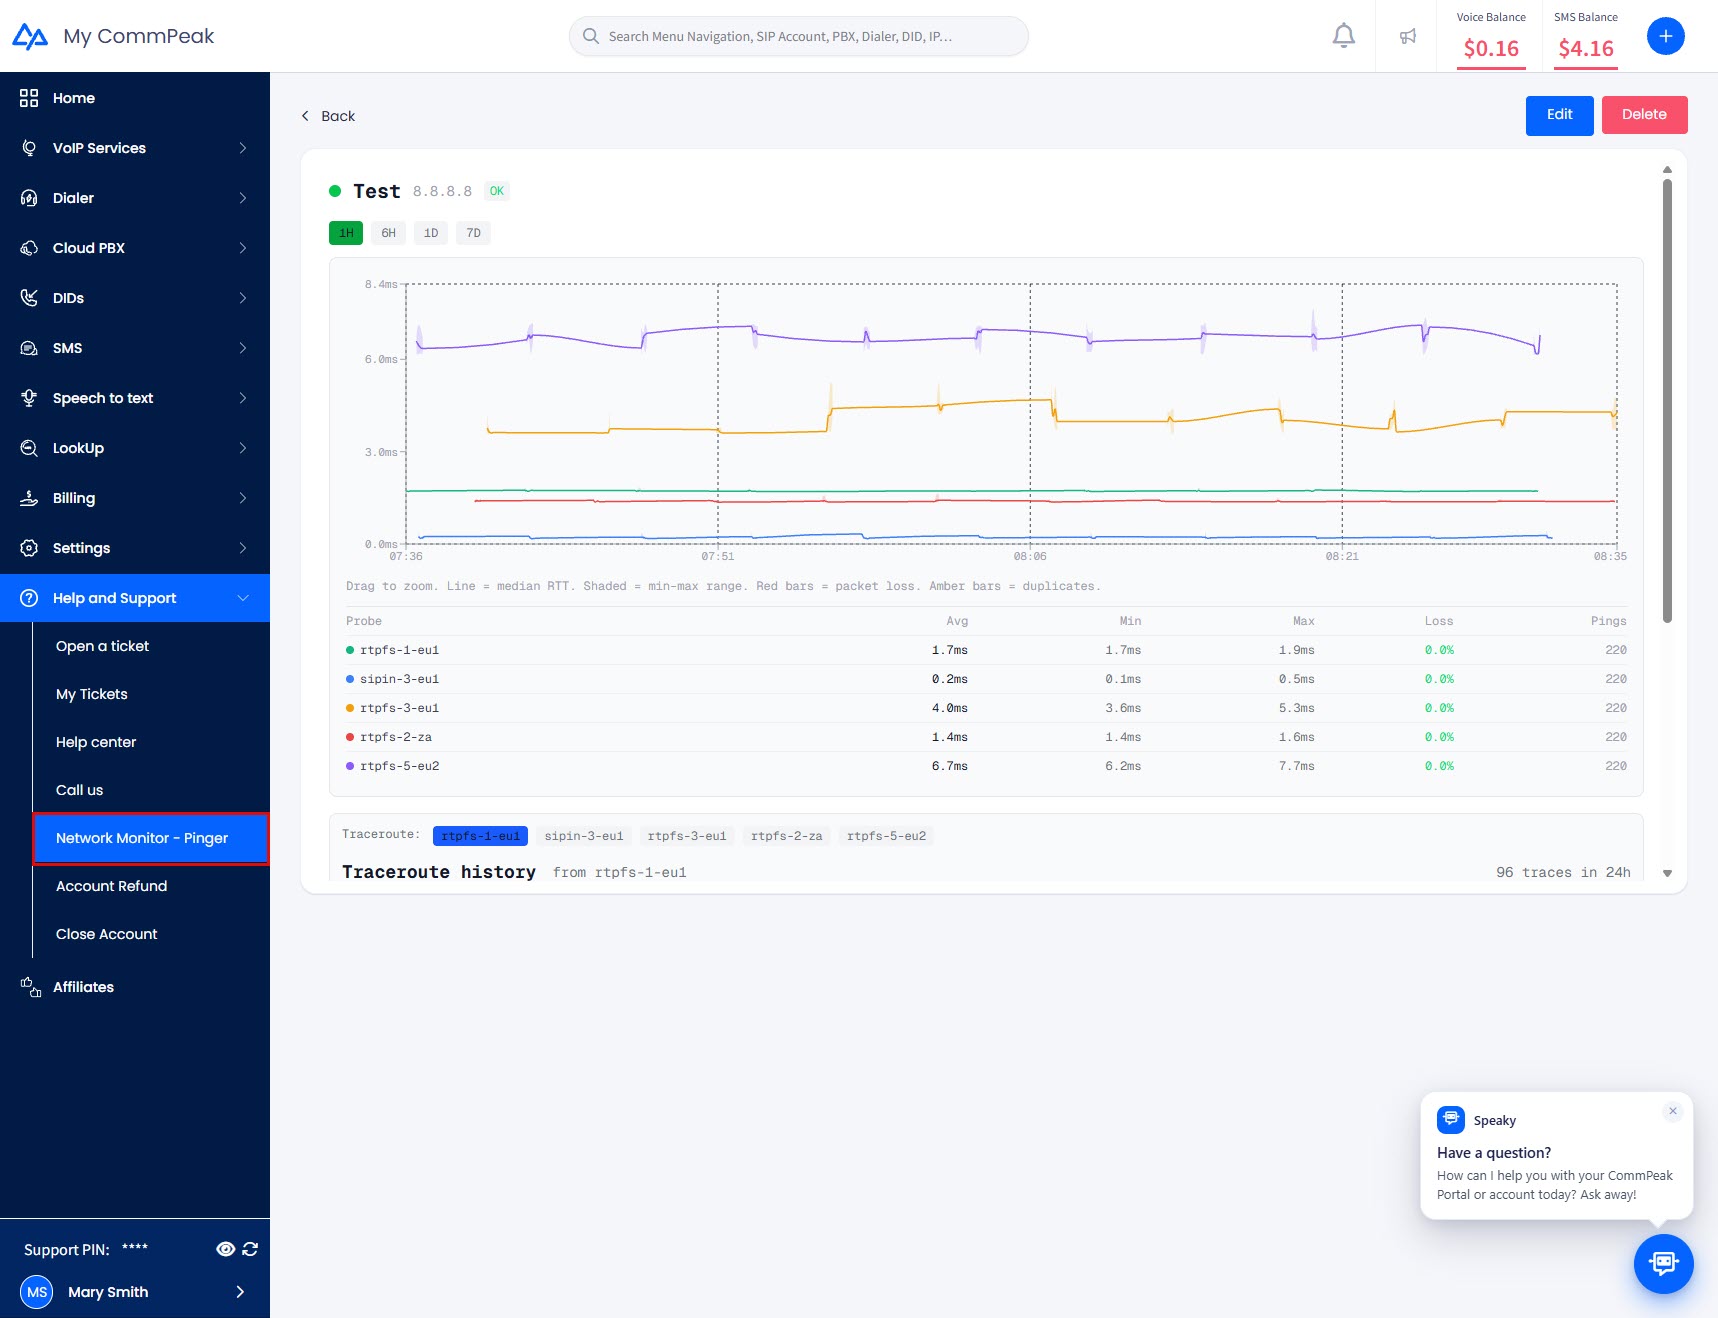
Detailed Statistics in Fullscreen Mode
Expand the window to full-screen mode to access advanced statistics for your monitored host (IP).
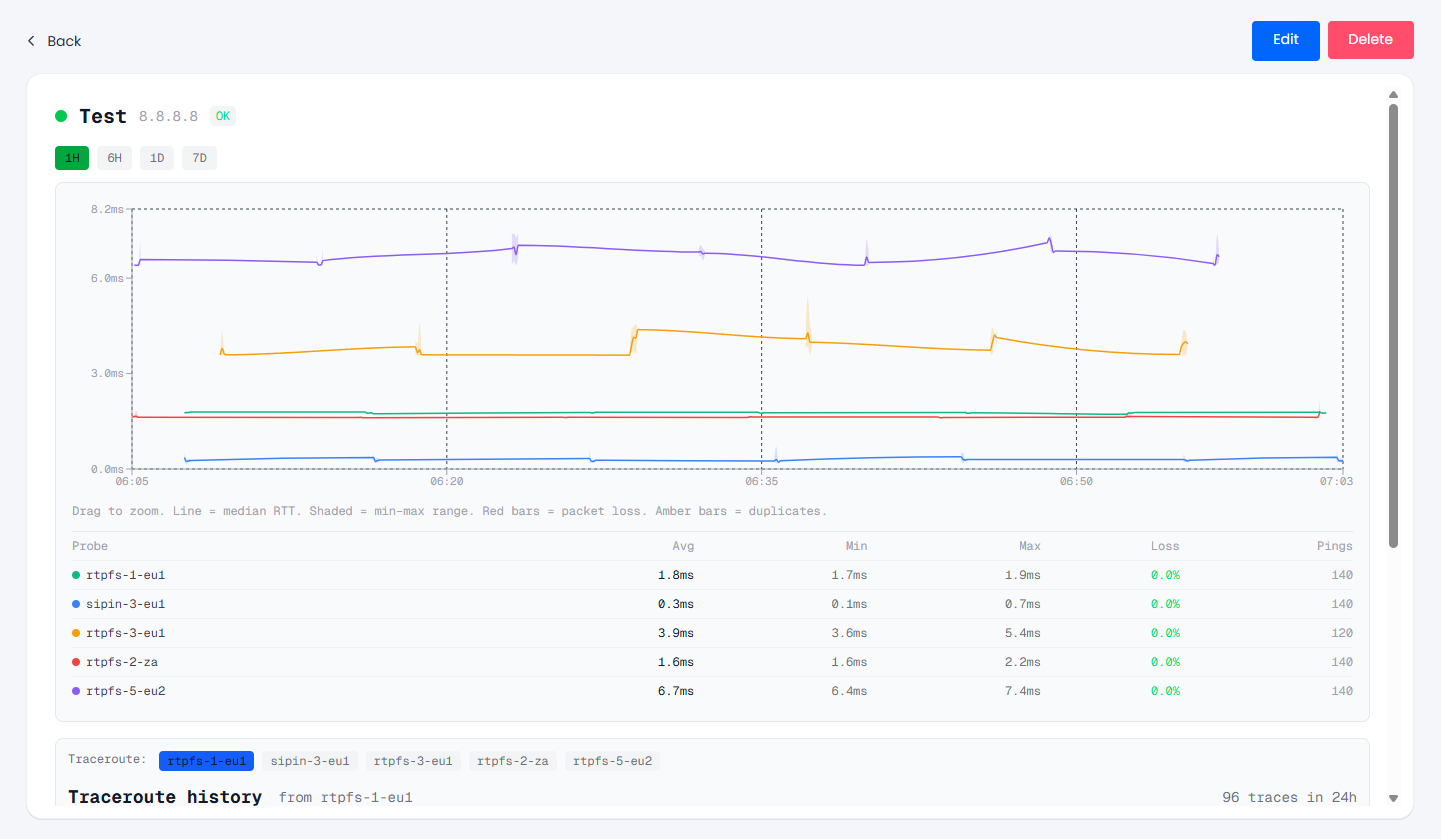
Fullscreen mode
You can customize the timeframe or zoom into specific data points by selecting a period directly on the graph.
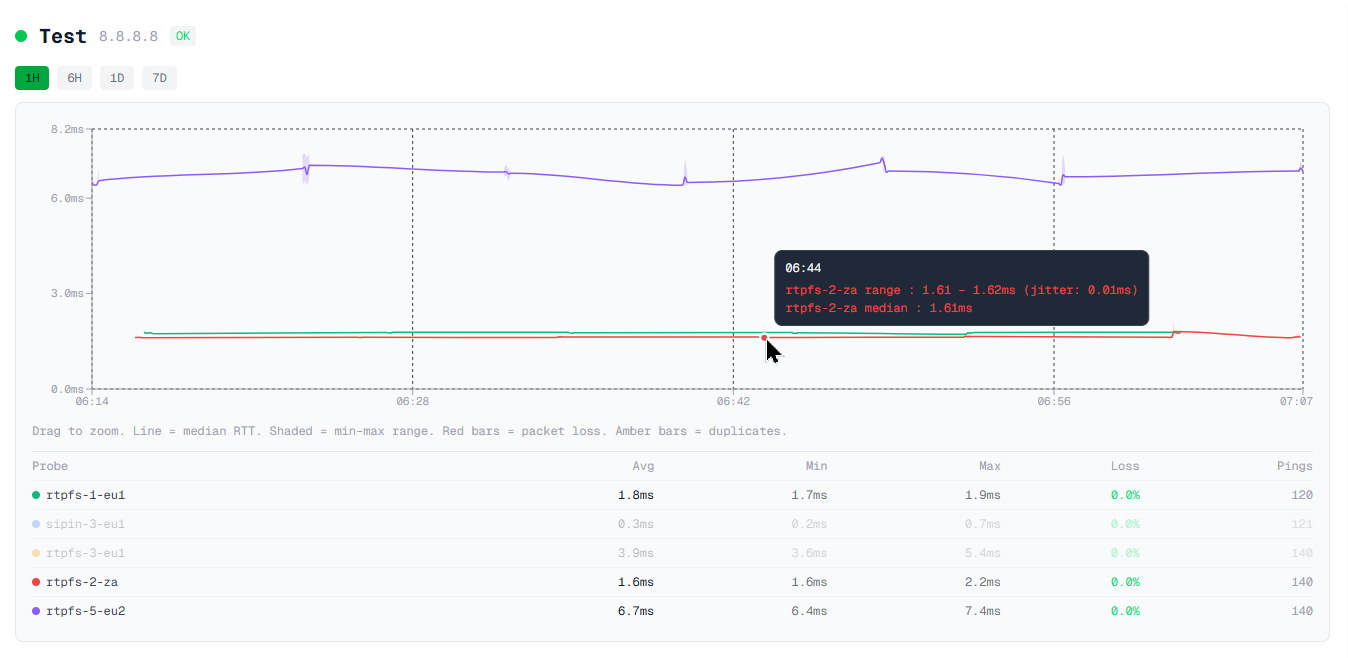
Data points details
This view also provides detailed insights into latency trends, jitter, packet loss, and traceroute history.
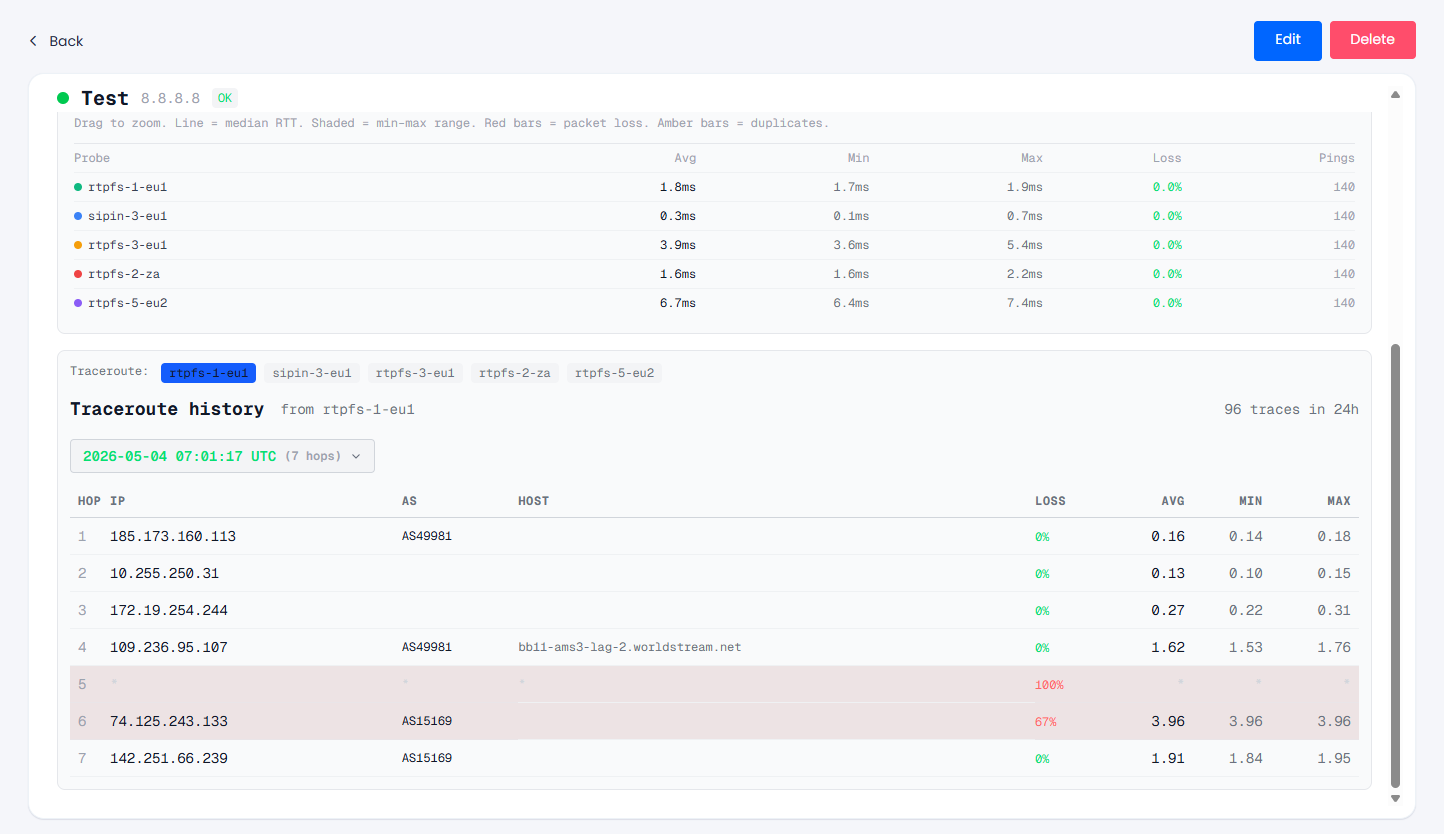
Traceroute history section
Updated 11 days ago