Overview of your operations from the Home page, your customizable CommPeak Portal Dashboard
In this article, you will learn what's in the MyCommPeak PortalHome page that features the CommPeak PortalDashboard, a customizable interface designed to provide you with an immediate overview of your most critical data and quick access to essential functionalities.
Your First Steps
After your first login, you will find yourself on the Portal Home page's welcome screen, where the onboarding instructions will guide you through the required steps before you can start using the CommPeak services.
Your first SIP account has been created automatically and is already available. You can see your username and domain, and are free to proceed configuring your password settings.
Before you can make your first call, you will also need to register a softphone application.
With CommPeak Softphone, you get an enterprise-level tool without installing third-party software.
You can also use the Built-in CommPeak Softphone with your JWT-enabled SIP accounts to place calls right from your browser. You can check the Built-in Softphone for JWT-Enabled SIP Accounts article to learn how to do it.
You are also free to use a third-party application or your IP phone to make your first call. Please see the SIP Account Configuration article to learn more about your options for registering a SIP account.
📘
NOTE
Later, you can set Caller ID, change authentication settings, or add more SIP accounts. For more information, refer to the article on Configuring SIP Accounts.
My CommPeak Dashboard Essentials
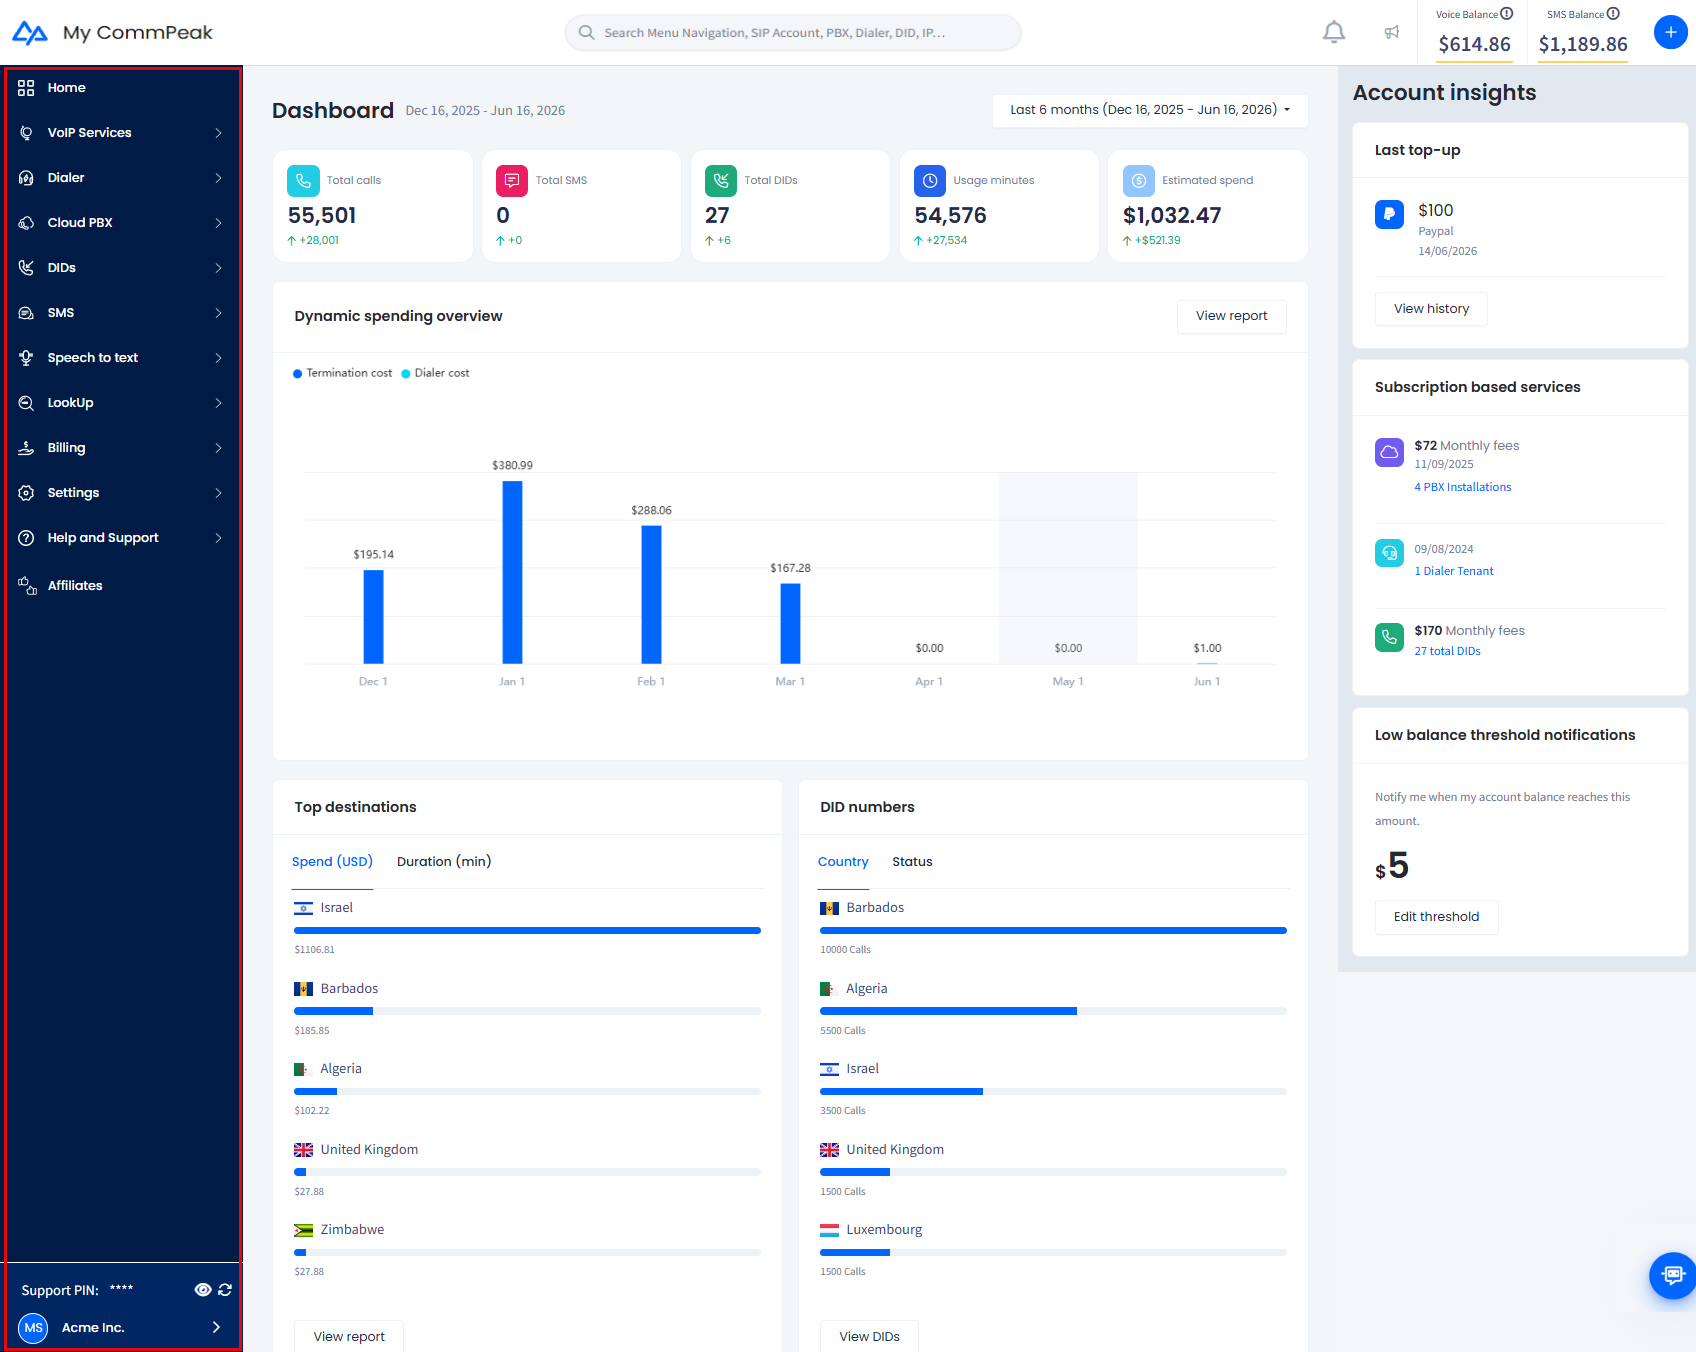
The CommPeak's Home > Dashboard is your personalized central hub within the Portal, where you can monitor key performance indicators, track your spending, and access quick insights into your operations. It serves as your starting point for reviewing recent activity, spotting spending trends, and keeping an eye on your account health.
The Home > Dashboard pane is organized into two areas:
The Dashboard main panel, where you review your activity statistics, spending trends, top destinations, and DID numbers for a selected time period.
The Account insights panel on the right, where you can see your latest top-up, consumption rates, subscription-based services, and low balance threshold.
My CommPeak Home page: Dashboard and Account insights panels
📘
NOTE
Your search bar, notification controls, Voice Balance and SMS Balancemonitoring blocks, and the plus (+) button for adding credit appear in the top bar on every Portal page. To learn more about these controls, see the CommPeak Portal Overview article.
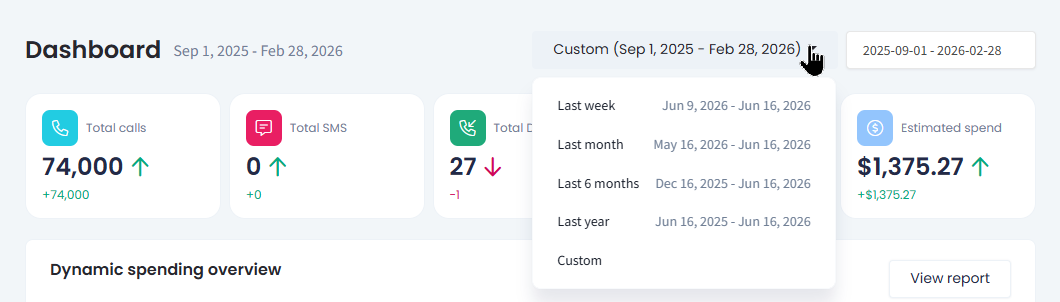
Use the date range selector at the top of the main panel to set the time period for all statistics on the Dashboard. You can choose Last week, Last month, Last 6 months, Last year, or set a Custom range.
Time period selector
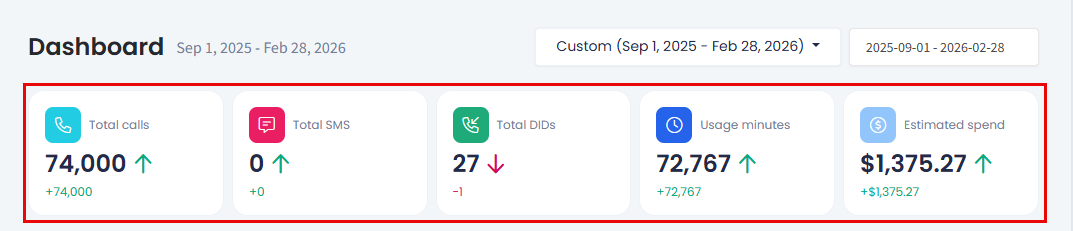
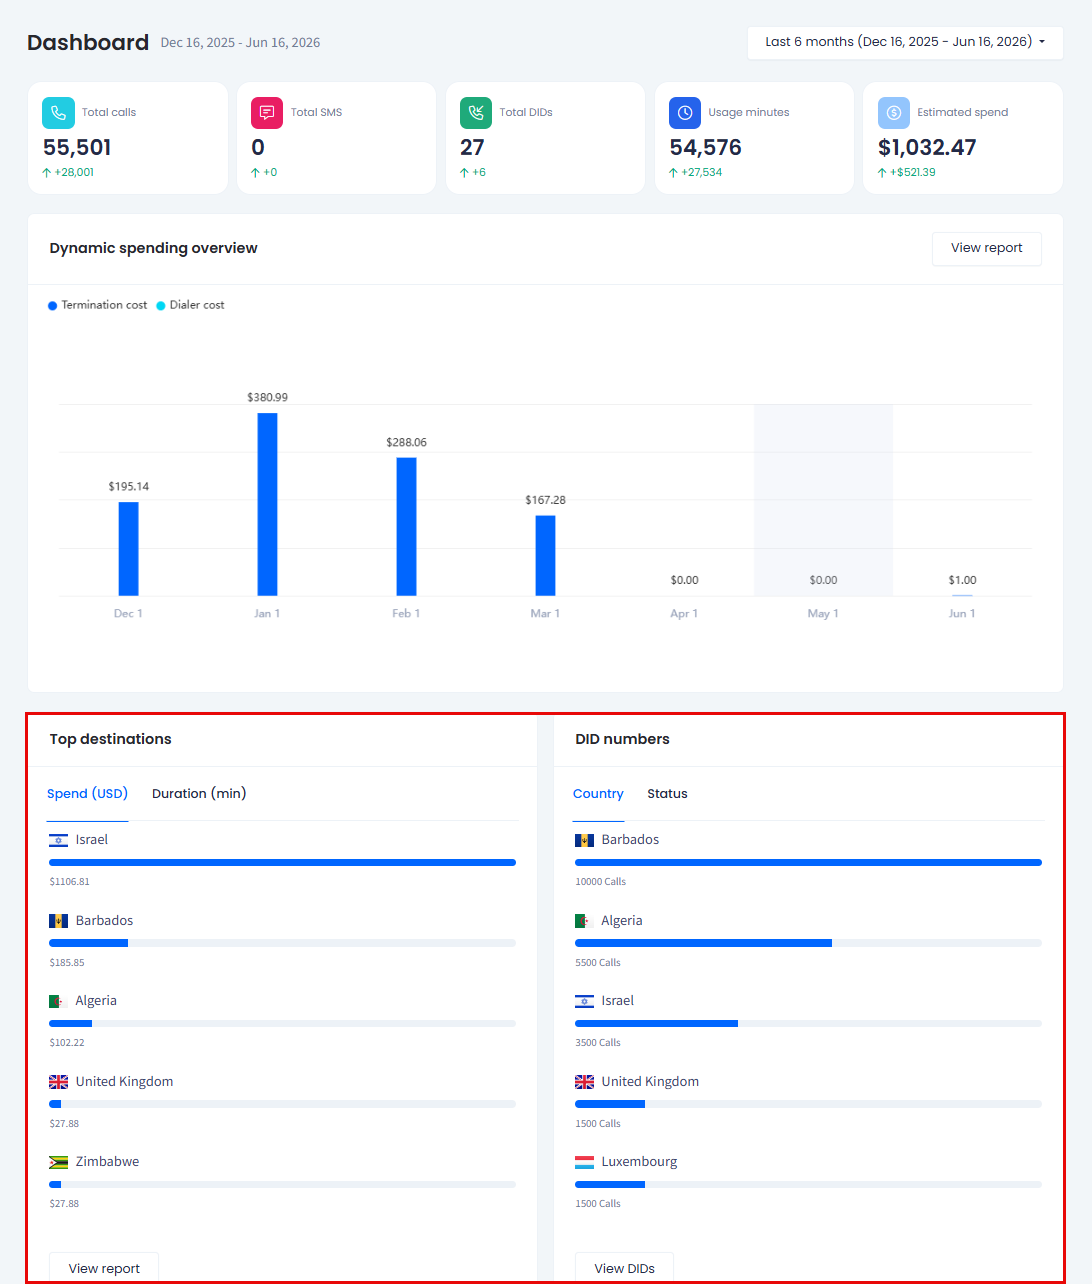
The summary cards below the selector give you a quick read on your activity for the selected period, with an arrow and a value that compare each metric of the services used under your account to the previous period:
Total calls: the number of calls placed
Total SMS: the number of messages sent
Total DIDs: the number of active DID numbers on your account
Usage minutes: the total call minutes used
Estimated spend: your approximate spending for the period.
Dashboard summary cards
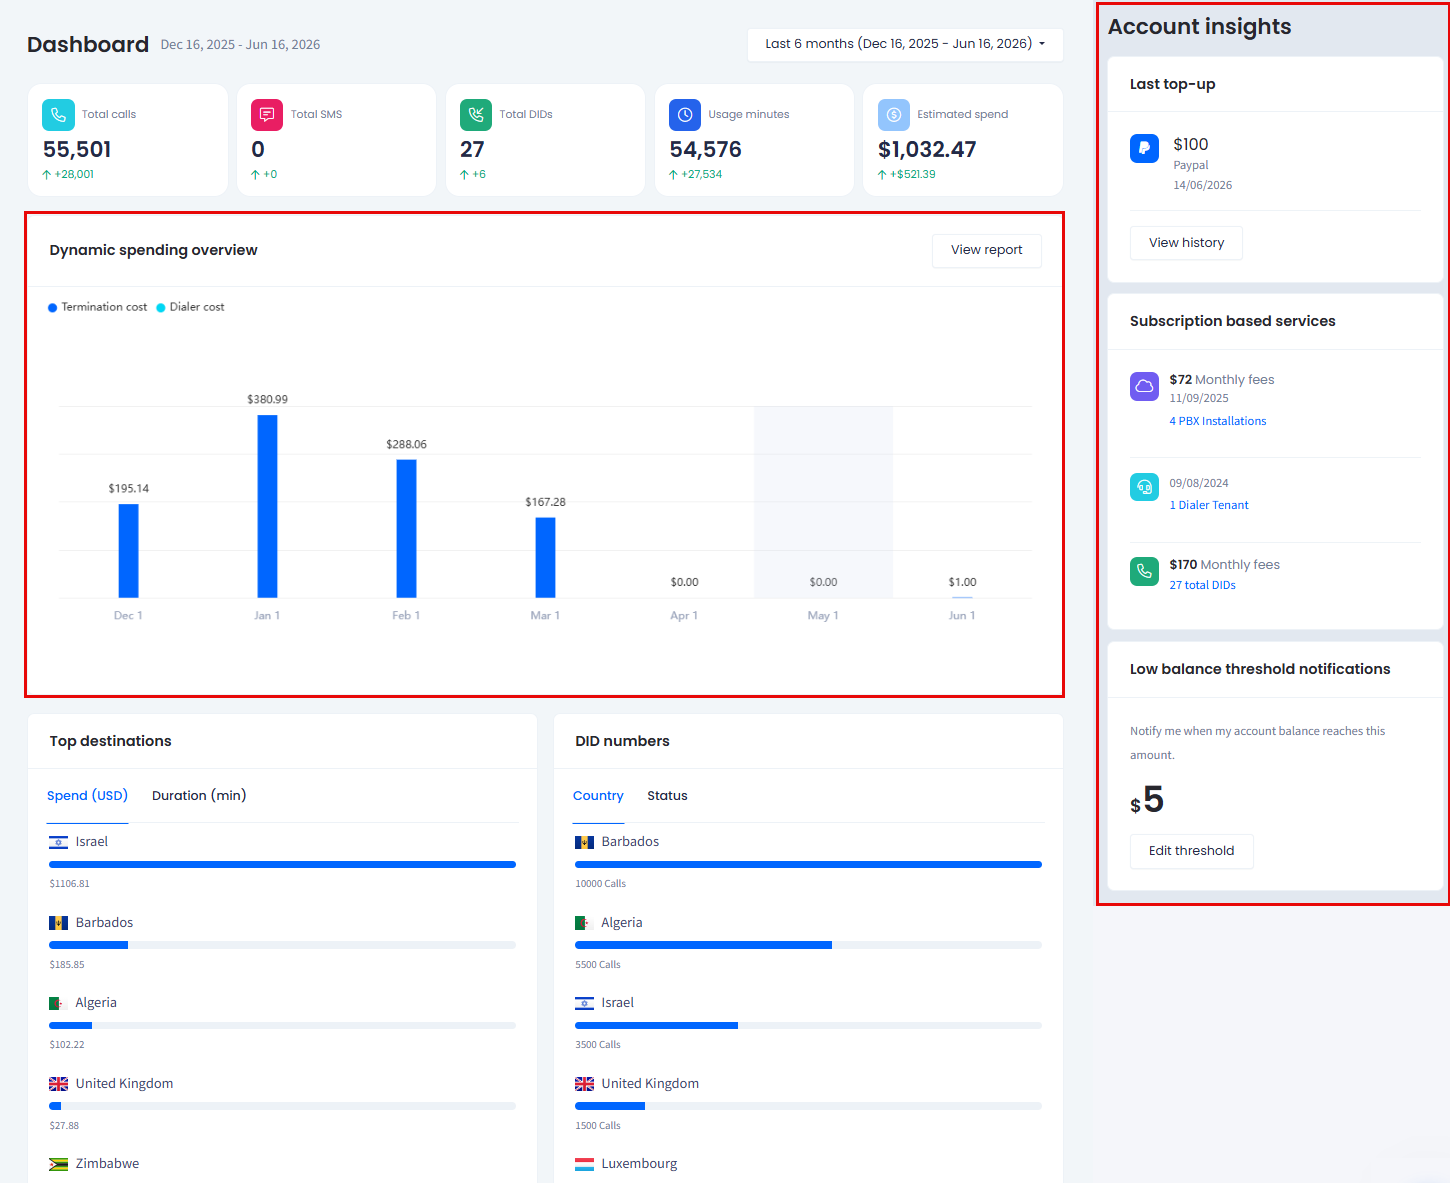
Monitoring your spending and account insights
The Dashboard also gives you a financial snapshot of your account.
Dynamic spending and account insights overview
The Dynamic spending overview chart tracks your daily spending across the selected period, and the Account insights panel on the right shows your last top-up, consumption rates, subscription-based services, and low balance threshold.
Monitoring your spending and account insights
📘
NOTE
To learn how to read the spending graph and each Account insights box, see the Monitoring Spending from Dashboard guide. For full reporting on your call and expense history, see the Reports article.
Top destinations and DID statistics
Two panels below help you understand your traffic and numbers at a glance:
Top destinations and DID numbers sections
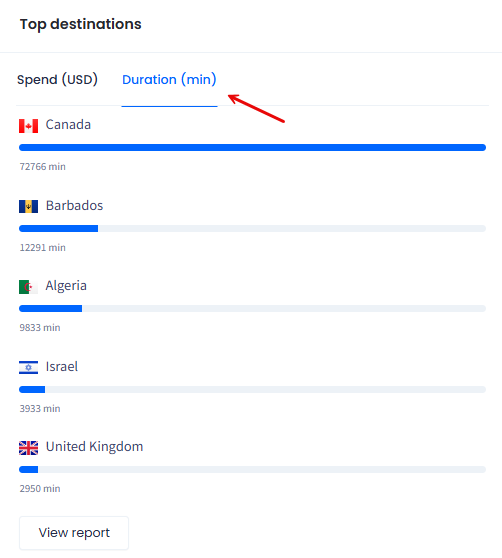
Top destinations lists the destinations you use most. Switch between the Spend (USD) and Duration (min) tabs to rank them by cost or by call time, then click View report to open the full report.
Top destinations tabs
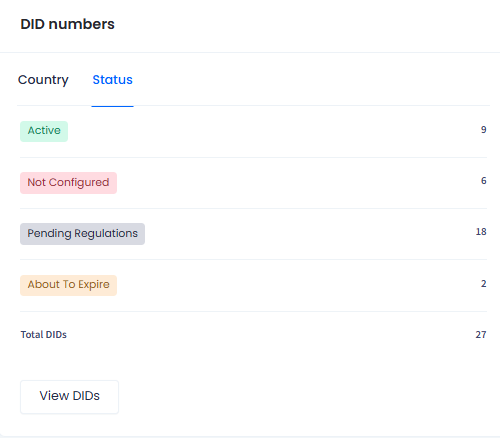
DID numbers summarizes your DID numbers inventory. Switch between the Country and Status tabs to see them grouped by country or by status, then click View DIDs to manage them.
DID numbers statistics grouped by status
📘
NOTE
To learn more, see the Reports article for reporting and the DID Inventory: My DIDs article for managing your numbers.