TextPeak Dashboard
Get insights into your account performance with TextPeak Dashboard. Learn about key statistics, recent campaign activity, and domain management features to optimize your SMS campaigns.
The Dashboard page is the homepage of your TextPeak account. To access the dashboard, log in to your TextPeak account and click Home in the main menu on the left.
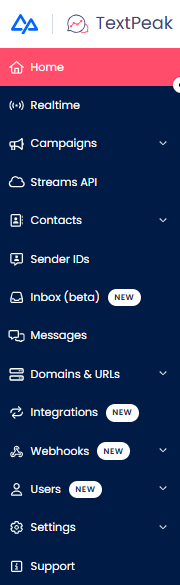
Home tab in the TextPeak main menu
Here, you can see the main statistics of your account for the selected period.
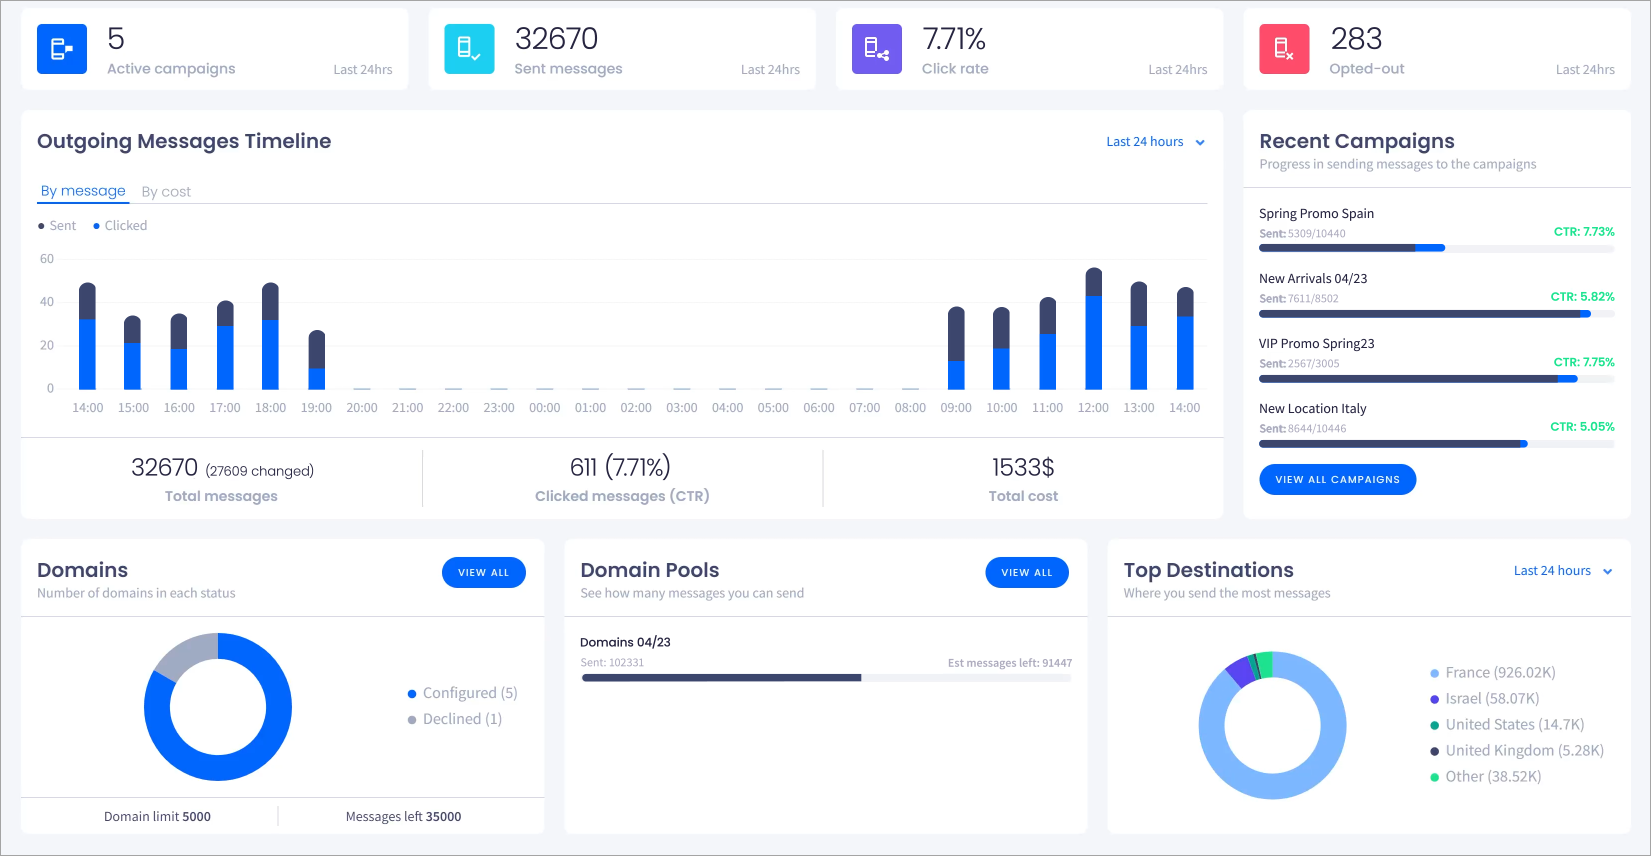
TextPeak Dashboard
Last 24-Hour Statistics Boxes
At the top of the page, you can see the basic statistics for the last 24 hours:
-
Number of active campaigns
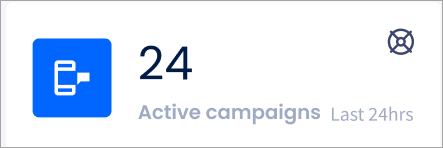
Active campaigns number
-
Number of messages sent
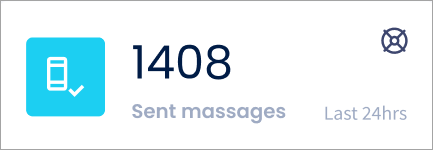
Number of sent messages
-
Percentage of contacts who clicked on links in the received messages (CTR)
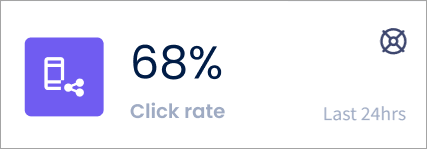
CTR percentage
-
Number of contacts who opted out
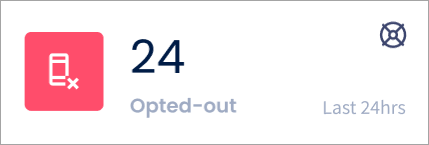
Number of contacts who opted out
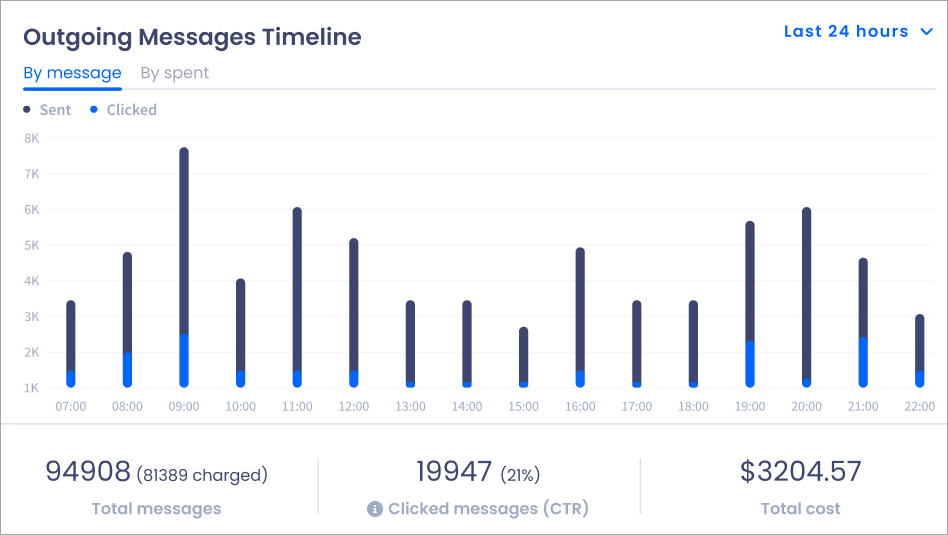
Outgoing Messages Timeline
This graph shows your campaigns' recent activity timeline. You can switch between the tabs to view the output by the number of messages sent or the amount you have spent.
In the By message option, the black color displays the total number of messages sent, and the blue color shows how many of them had clicked on links. By hovering over the graph, you will see the exact numbers.
On the right, you can choose the timeframe for the results displayed.
Totals for the selected time period are shown below the graph.
Outgoing Messages Timeline
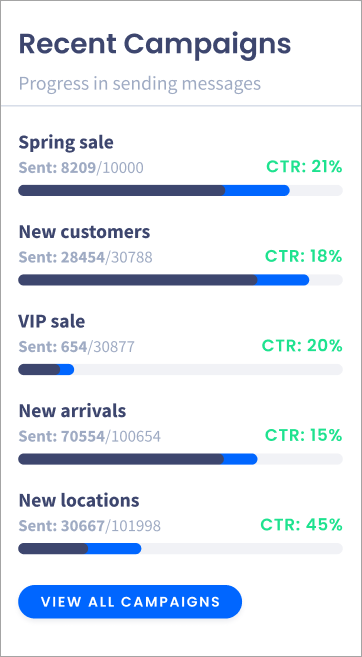
Recent Campaigns
In this section, you can monitor the total message amount, number of sent messages and clicks, and see the CTR for your recent active SMS Campaign. The campaigns are sorted by the latest message sent.
By clicking VIEW ALL CAMPAIGNS, you will be redirected to the Campaigns page and able to view the statistics for all your campaigns.
Recent campaigns statistics
Domains
In the Domains section, you can see a graph explaining the ratio of your domains by their status. If you hover over the sectors of the graph, you will see how many domains in each status you have.
If you are using the Domain Limit feature, the number of messages you can send per domain is shown below. You will also see how many messages you can still send with the domains you have.
Click VIEW ALL to view your domains on the Domain Management page.
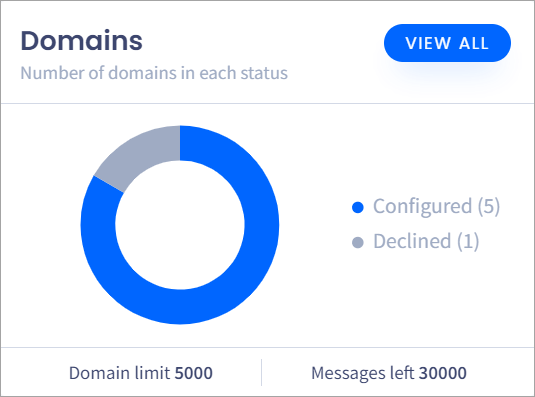
Domains statistics
Domain Pools
In the Domain Pools section, the graphs show how many messages you have sent and still can send within your domain pools.
Click VIEW ALL to open the Domain Pools page and view all your domain pools.
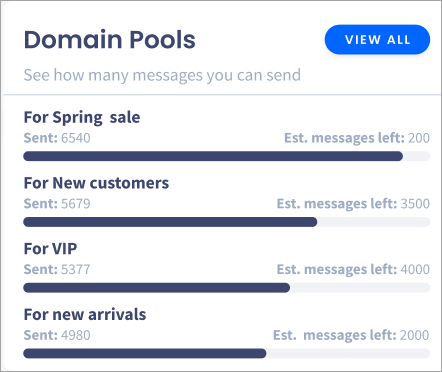
Domain pools
Top Destinations
Here, you can see the top 5 destination countries by the number of messages sent. When you hover over the graph, the sectors show the exact numbers.
At the top right, you can choose the time period.
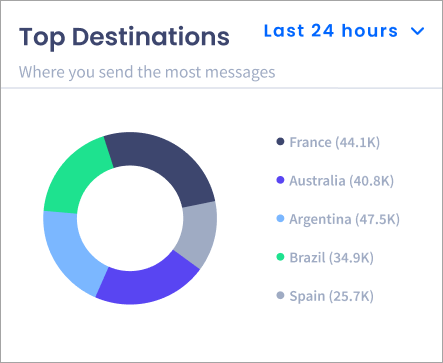
Top destinations statistics
Updated 6 months ago