Call Graphs
View call statistics: status, average duration, answer-seizure rate, and length of calls by date range.
Statistics are shown for the selected date range.
To view the graphs:
-
In your CommPeak account, expand VoIP Services in the left pane and click Call Graphs.
Call Graphs in the main menu
-
Select the date range and click Generate.
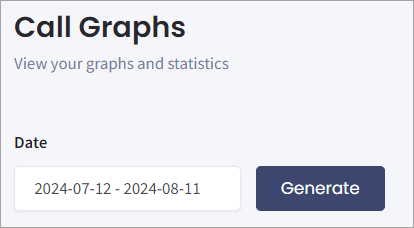
Call Graphs page
Please visit the following sections for each graph example.
Call Status
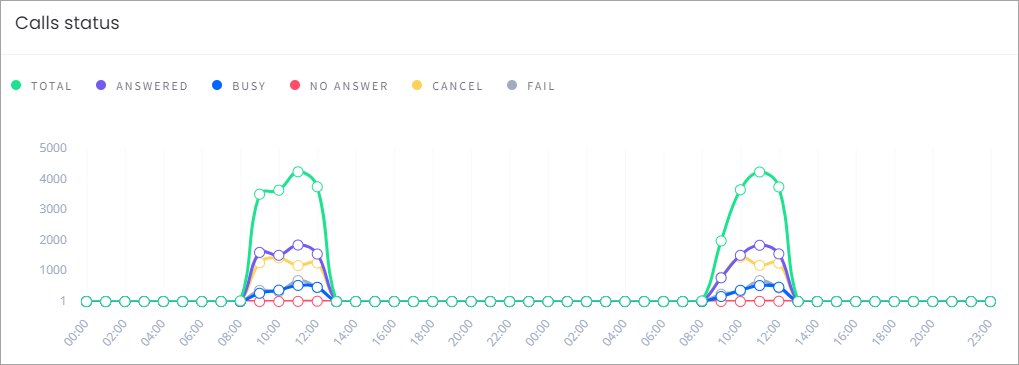
Call Status page
Hover your mouse over an area in the graph to see details for the respective date.
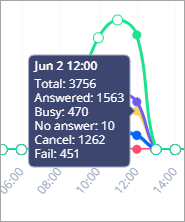
Detailed data on the graph
Duration of Calls
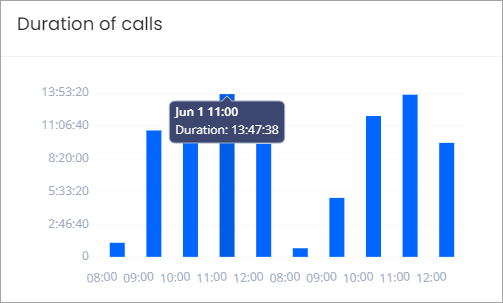
Duration of Calls section
Calls ASR
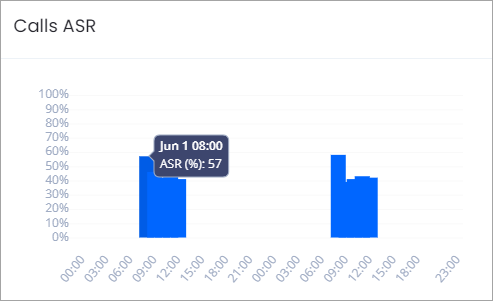
Calls ASR section
Length of Calls
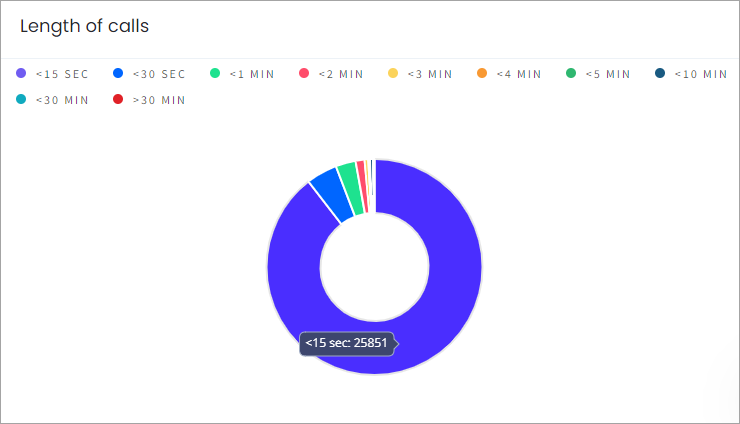
Length of Calls section
Updated 4 months ago
Did this page help you?