Network Statistics
Monitor network latency for PBX extensions from the CommPeak Portal: select a date range, view graphs for all extensions, or display statistics for specific extension(s) to identify potential network issues affecting call quality.
On the Network Statistics page of the CommPeak Portal, you can monitor Network latency for all your PBX extensions, including CommPeak Softphone, any other 3rd party softphones, or IP phones.
To load PBX network statistics:
-
In the CommPeak portal, expand Cloud PBX in the left pane and click PBX Instances .
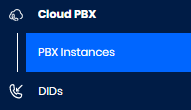
PBX Instances in the main menu
-
Locate the needed instance in the PBX Instances table, click the three-dot icon on the right of this instance, and select the Network Statistics option.
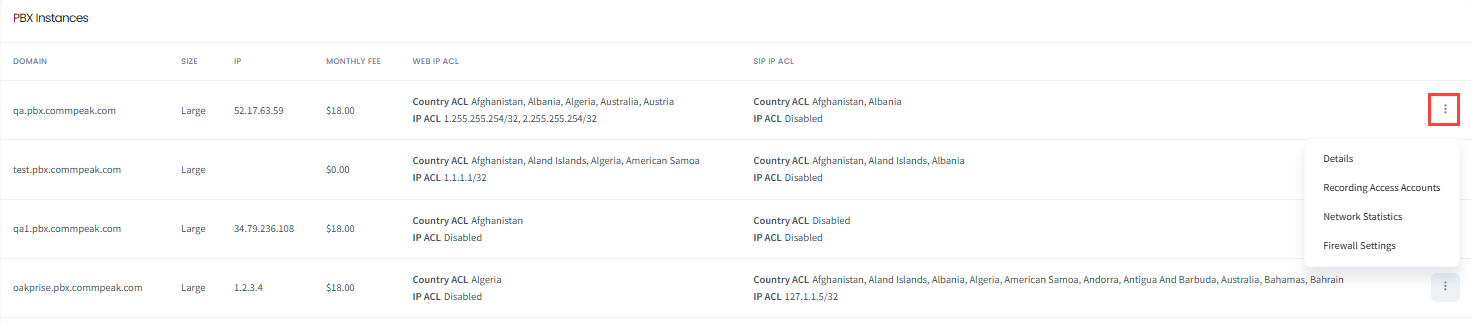
PBX Instances table
- Select beginning and end dates and times in UTC in the interactive calendar, then click SHOW STATISTICS.
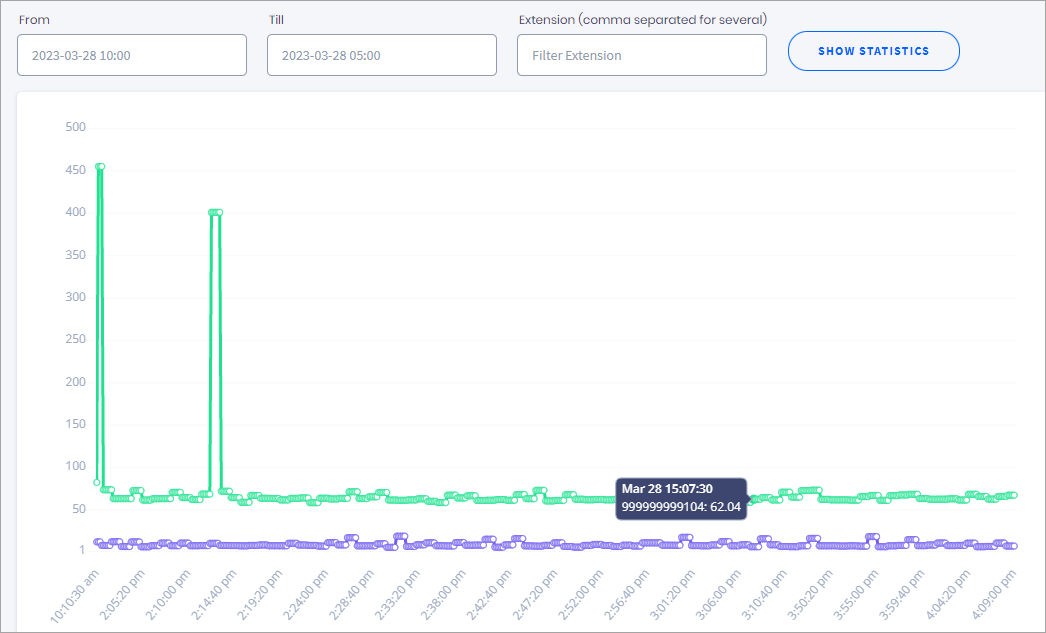
Network statistics graphs
- The resulting window displays network latency in milliseconds (ms) over time. It contains graphs for all extensions registered on the PBX server. Hover over the graph to see the extension number.
- To display the statistics for specific extension(s), enter one or several numbers separated by commas in the extension box as follows, then click SHOW STATISTICS:
-
999999999 + agent login (e.g., 9999999992000) for CommPeak Softphone
-
device number only (e.g., 500) for Zoiper, any other 3rd party softphones, or IP Phone devices.
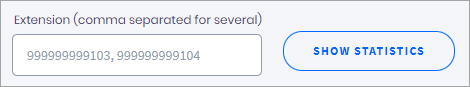
Displaying statistics for an extension
NOTEThe acceptable latency value should not exceed 150ms. The peaks on the graph indicate network issues on your side that affect the quality and stability of your agent calls.
Updated 6 months ago