CommPeak Looking Glass
The CommPeak Looking Glass service is a web-based network diagnostic tool to help you troubleshoot connectivity and routing issues without direct server access.
The CommPeak Looking Glass service is a web-based network diagnostic tool with a user-friendly interface that allows you to run standard network tests from various server locations to a specified target.
It offers ICMP & traceroute services as a tool to check latency or traceroute from CommPeak's worldwide spread PoPs towards your network, and can be very helpful for network administrators and users in troubleshooting connectivity and routing issues without direct server access.
Core Features
- Real-time output: The output of the service commands (ping, traceroute, MTR) is streamed in real-time to your browser, providing an experience similar to a command-line terminal.
- Cross-platform compatibility: The web interface is fully responsive and works on desktop and mobile devices.
- Security and rate limiting: The backend includes robust security measures to prevent abuse, including rate-limiting the number of commands a single user can execute within a specific timeframe.
- Nodes feature: This key feature presents a list of available servers (CommPeak SIP Signalling Point of Presence (POP)s) from which you can run your network diagnostics.
Using CommPeak Looking Glass
- Go to https://www.commpeak.com/looking-glass.
- On the Looking Glass page, select a network node. From the list of nodes on the left (CommPeak SIP Signalling Point of Presence (POP)s), select the server location by checking the corresponding checkbox of the network node to set it as the starting point for your network test. All the nodes on the list are grouped by regions, and every node card has a SIP or Media label and features the provider tag. You can select multiple nodes or apply filtering by IPs, providers, or POPs.
- The selected nodes will be shown on the right pane; all are clickable and, if selected, can take you back to the corresponding node card.
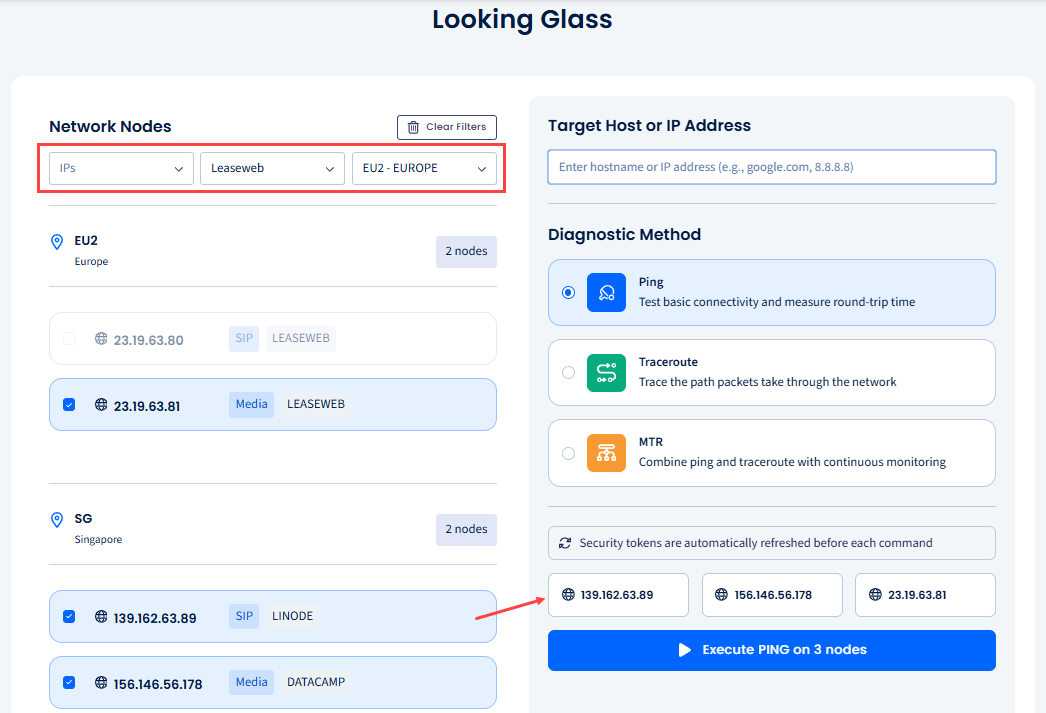
Selecting nodes
- Next, in the Target Host or IP Address input field on the right, enter the target hostname (e.g., google.com) or an IPv4 or IPv6 address you want to test.
- Then, select the network diagnostic tool you want to use:
- Ping: This tool tests the basic connectivity to the target and measures the round-trip time for packets.
- Traceroute: This tool traces the network path to the target, displaying each "hop" (router) along the way and the latency to each hop.
- MTR (My Traceroute): This tool combines the functionality of ping and traceroute into a single, continuous report. It provides live statistics on packet loss and latency for each hop.
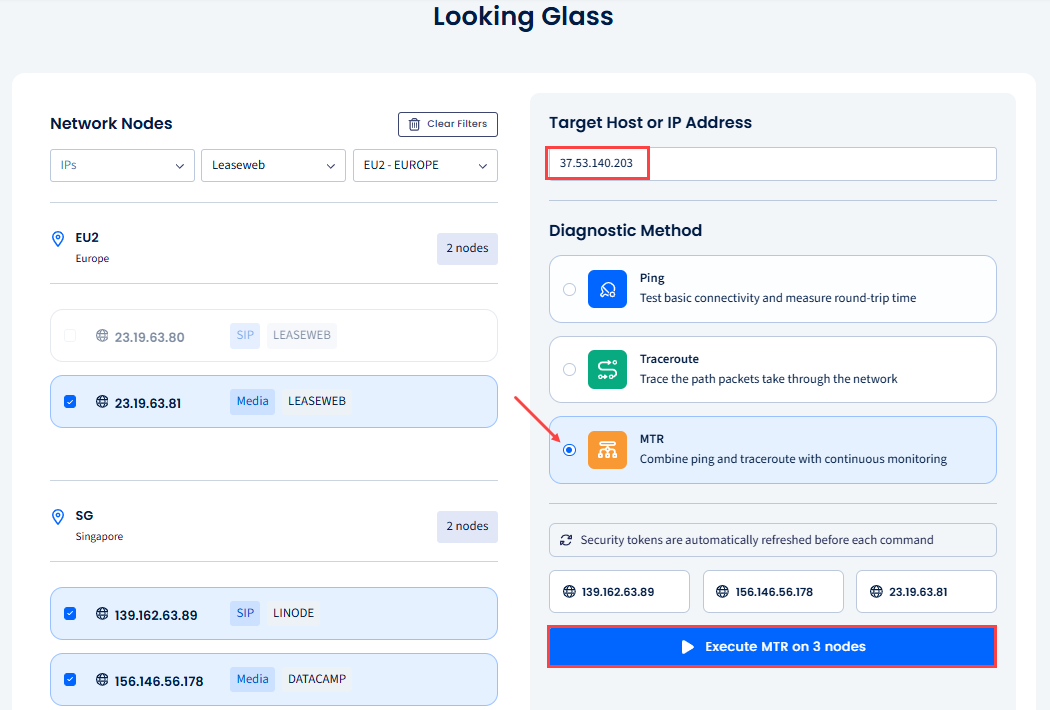
Executing MTR on 3 nodes
- Finally, click the Execute button below to run the test.
- In a moment, the Diagnostic Results window with the real-time testing output opens. In this page, you can view, copy, or download the testing results for .
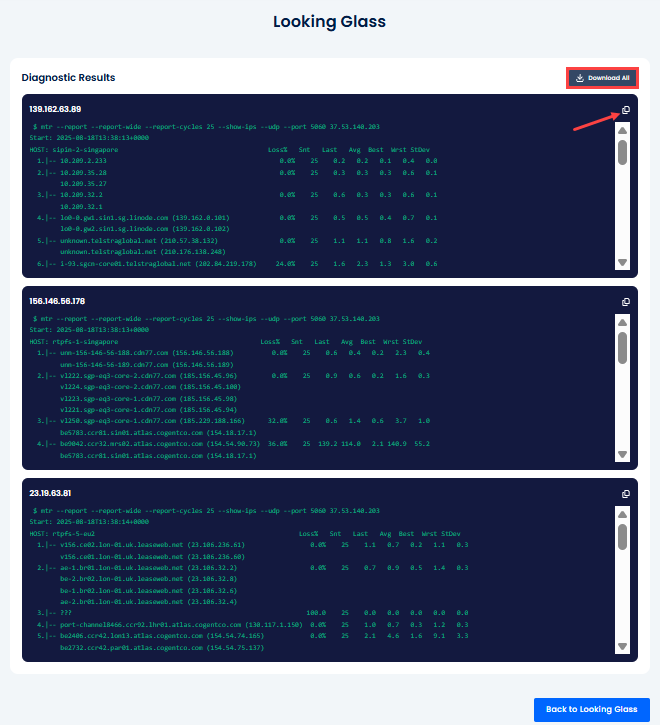
Diagnostic Results page
NOTEYou must select at least one node to execute diagnostics.
Updated 6 months ago