Network Stats
Monitor network performance across call center regions with detailed ping and jitter metrics. Learn how to use charts to track connectivity issues, ensure stable communication for agents, and save key reports for analysis.
Several tabs under Reports > Network Stats provide insights into network performance across your call center regions in the Dialer or Cloud PBX, helping you monitor key metrics like network latency and jitter for each region. With this data, you can dig into connectivity issues and ensure stable communication for agents across different regions.
Network Stats
The Network Stats report (Dialer → Reports → Network Stats) shows the quality of the WebSocket connection between each agent's web browser and the Dialer web app. Every time an agent opens the Dialer in a browser, the app keeps a live WebSocket channel open to receive call events, status updates, and page data in real time. This report measures how well that channel is performing.
If an agent complains that the Dialer feels "laggy", that buttons take a second to react, that calls appear or disappear with delay, or that the app keeps reconnecting - this is the first report to open.
The redesigned report is built around three ideas:
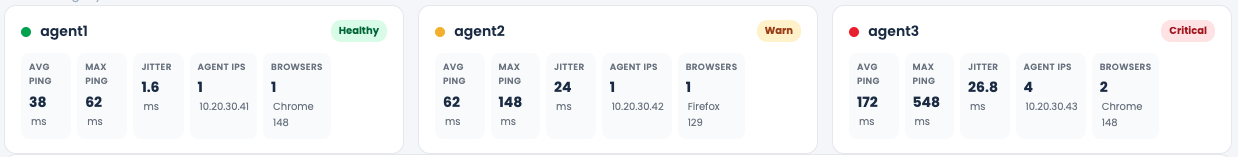
- See health at a glance: every user gets a colored status badge (Healthy / Warn / Critical) so you can scan a whole team in seconds.
- Drill down without leaving the page: WebSocket ping, jitter, IP changes and browser changes are all stacked under the same user card.
- Catch instability, not just slowness: timelines highlight IP and browser switches during the session, which are often the real cause of "the app dropped me out" reports.
NOTEYou can still open the previous version any time with the Switch to legacy view link at the top of the report.
What the report measures
All metrics are measured on the WebSocket the browser keeps open to the app, not on voice/RTP or the PBX.
| Metric | Description | Healthy range |
|---|---|---|
| Avg Ping | Average round-trip time of WebSocket ping frames between the agent's browser and the web app, in milliseconds. | 0–100 ms |
| Max Ping | The single highest WebSocket round-trip seen during the period. Useful for spotting spikes that cause momentary UI freezes. | < 250 ms |
| Jitter | Variation between consecutive WebSocket pings. High jitter means an unstable connection even when average ping is fine - events arrive in bursts instead of smoothly. | < 30 ms |
| Agent IPs | How many different public IPs the agent's browser used while connected. More than one usually means the connection dropped and re-opened from a new network (Wi-Fi switch, VPN reconnect, hotspot fallback). | 1 stable IP |
| Browsers | How many different browser / user-agent strings the same user logged in with during the period. | 1 stable browser |
Ping latency on a WebSocket is the time it takes a small ping frame to travel from the browser to the app server and back. Values 0–250 ms feel instant; anything above 450 ms is treated as bad and will be visible to the agent as a sluggish UI, delayed call events, or "reconnecting…" banners.
Health badges
Every user card gets a status badge derived from the metrics above:
- 🟢 Healthy: ping, jitter and switch counts are all inside the green band.
- 🟡 Warn: at least one metric is in the yellow band (e.g. occasional ping above 100 ms, jitter climbing, one IP switch).
- 🔴 Critical: sustained high WebSocket latency, very high jitter, or many IP / browser switches. The agent's Dialer experience is degraded - investigate.
Chart backgrounds are also color-banded (Good / Warn / Bad), so any spike that crosses into trouble territory is obvious at a glance.
Filtering the report (Search Params)
| Filter | Purpose |
|---|---|
| Period | Pick the date range to analyze. Only the last 14 days of WebSocket data are retained - older data is not displayed. |
| Remote IP | Type an IP and click Add to keep only sessions coming from that IP. Useful for isolating one office, one home connection, or one VPN exit. Multiple IPs can be added. |
| User agent | Limit results to one or more browser families: Chrome, Firefox, Opera, MSIE. |
| Users | Multi-select the agents you want to compare. Defaults to a small set so the charts stay readable. |
Click Generate Chart to (re)render the report with the chosen filters.
Reading a user block
Each selected user gets two stacked elements:
1. Summary card: the health badge plus five KPI tiles:
● Agent1 Critical
AVG PING MAX PING JITTER AGENT IPS BROWSERS
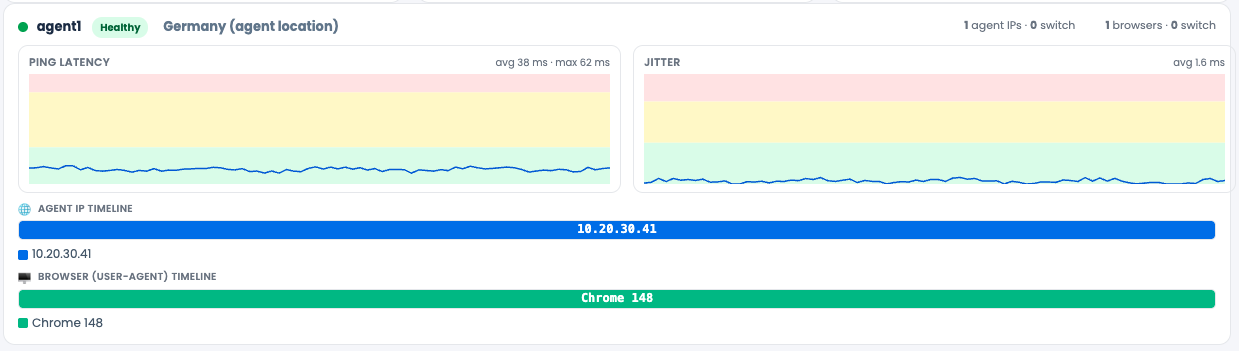
124 ms 476 ms 18.3 ms 1 (109.237.27.77) 1 (Chrome 148)2. Detail panel: four time-aligned visualizations of that user's WebSocket session:
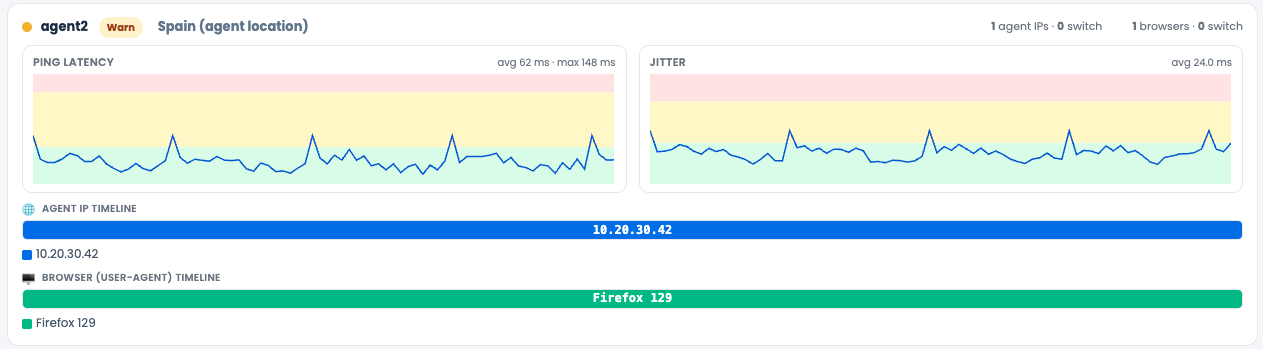
- Ping Latency chart: avg / max WebSocket round-trip across the period, with Good / Warn / Bad bands.
- Jitter chart: variation between successive pings, same time axis.
- Agent IP Timeline: a colored bar per public IP the agent's browser used. Each color change = one WebSocket reconnect from a new IP.
- Browser (User-Agent) Timeline: same idea, but for the browser / version the agent was logged in with.
A small counter on the right of the block summarizes activity, for example:
1 agent IPs · 0 switch 1 browsers · 0 switch
If you see something like 2 agent IPs · 5 switch, the agent's WebSocket dropped and reconnected from a different IP five times during the period - a strong signal of unstable Wi-Fi, a flapping VPN, or a load-balanced router behind the agent.

Benefits
- Faster triage of "the Dialer is slow" tickets. Open the report, find the agent, and you instantly know whether the issue is the browser↔app WebSocket (latency / jitter / reconnects) or somewhere else.
- Proactive monitoring. Healthy / Warn / Critical badges let team leads scan dozens of agents in one screen instead of opening each session individually.
- Pinpoint the root cause. Latency and jitter charts share the same time axis as the IP and browser timelines, so a spike in ping that lines up with an IP switch is an obvious "network reconnect" story.
- Office vs. home visibility. The Remote IP filter isolates a single office, a specific home worker, or a VPN exit point.
- Change tracking. The Browser timeline shows when an agent moved from one browser/version to another - useful when investigating sudden quality drops after an update or when verifying a browser rollout.
- One screen instead of digging in logs. What used to require correlating server-side WebSocket logs with agent reports is now in one view, scoped to the last 14 days.
Examples
Example 1: A healthy agent
● Agent2                                                  Healthy
AVG PING 12 ms   MAX PING 38 ms   JITTER 2.1 ms   AGENT IPS 1   BROWSERS 1
The Ping and Jitter charts stay inside the green band for the full period. The IP timeline and the browser timeline are each a single solid bar - the agent kept one stable WebSocket session from one IP, on one browser. Nothing to do.
Example 2: A Critical agent (real sample from the report)
● Agent1                                               Critical
AVG PING 124 ms   MAX PING 576 ms   JITTER 18.3 ms
AGENT IPS 1 · 1.2.3.4        BROWSERS 1 · Chrome 148
The WebSocket is stable on the identity side - one IP (109.237.27.77), one browser (Chrome 148), no reconnects. But the channel itself is slow: ping averages 124 ms with peaks of 476 ms, and jitter is around 20 ms. The agent will feel the Dialer "lagging" - events arriving late, buttons feeling slow. This is a pure connectivity-quality problem on the agent's side: long-distance Wi-Fi, a saturated home uplink, or a noisy local network. Recommendation: switch to wired Ethernet, restart the router, or move the workstation closer to the access point.
Example 3: Unstable WebSocket (frequent reconnects)
● jdoe                                                   Warn
AVG PING 60 ms   MAX PING 580 ms   JITTER 9 ms
AGENT IPS 3 · 2 switch              BROWSERS 1
Latency is borderline OK, but the Agent IP Timeline shows three different IPs and two switches during the shift. Each color change is a WebSocket reconnect - every one of them is a brief moment when the Dialer was "offline" for that agent. Typical cause: hopping between Wi-Fi and a phone hotspot, or a VPN that keeps re-establishing itself. Fix the network instability and the warnings disappear.
Example 4: Investigating a one-off complaint
A customer reports that the Dialer "froze" at 14:32. Open Network Stats, set Period to that day, leave only the relevant agent selected, and look at the Ping Latency chart at 14:32. A red spike there - especially if it lines up with a color change on the IP timeline - tells you the agent's WebSocket dropped and reconnected from a new IP at exactly that minute. You have the answer in under a minute.
Example 5: A browser version regression
● svetlana                                               Warn
AVG PING 30 ms   MAX PING 90 ms   JITTER 4 ms
AGENT IPS 1                          BROWSERS 2 · 1 switch
Ping and jitter are fine, but the Browser timeline shows the user switched from one browser/version to another mid-period. If complaints about the app started after the switch, you've found a possible browser-version regression - worth reproducing on that exact build.
Tips
-
Keep the Users list short (5–8 agents) for readable charts. Run the report multiple times for bigger teams.
-
Pair Network Stats with the Agents Devices Connection Status and Region Registration Users tabs (top of the same page) for a full picture of how agents are connecting to the app.
-
WebSocket data is retained for 14 days only. Export or screenshot anything you need to keep for longer.
-
A single IP switch in the middle of an 8-hour shift is normal. A pattern of repeated switches is not - that is your action item.
-
The legacy view is still accessible via Switch to legacy view for anyone who prefers the old layout.
Agent Devices Connection Status
The Agent Devices Connection Status report (Dialer → Reports → Network Stats → Agent Devices Connection Status) shows the network connection details between the PBX media server and each registered agent. This is the agent-to-PBX leg of every call - the path that actually carries voice - so it's the report you open when calls themselves sound bad: choppy audio, one-way audio, robotic voice, sudden disconnections, or registration drops.
The redesigned report is built around three ideas:
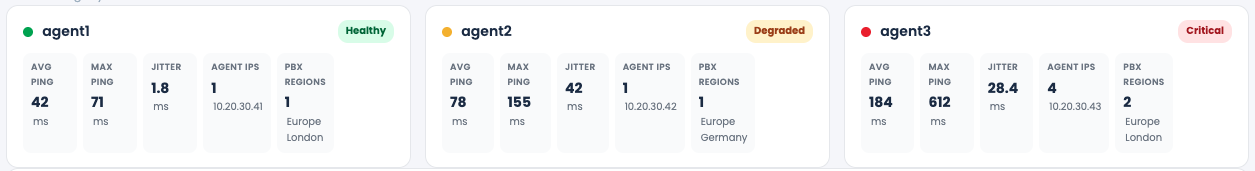
- See call-quality health at a glance every user gets a colored status badge (Healthy / Degraded / Critical) so you can scan an entire floor in seconds.
- Drill down without leaving the page ping, jitter, agent-IP changes and PBX-region changes are all stacked under the same user card.
- Catch instability, not just slowness timelines highlight when an agent's IP changed or when the agent's session moved to a different PBX region during the period.
NOTESYou can still open the previous version any time with the Switch to legacy view link at the top of the report.
Your available regions (PBX media servers) are listed in the info banner above the filters, for example:
1.1.1.1,2.2.2.2,3.3.3.3. You can use these IPs as ground truth when troubleshooting firewalls or VPN routing on the agent side.
What the report measures
All metrics are measured on the network path between the agent's device and the PBX media server that serves that agent's region.
| Metric | Description | Healthy range |
|---|---|---|
| Avg Ping | Average round-trip time between the agent's device and the PBX media server, in milliseconds. | 0–80 ms |
| Max Ping | The highest round-trip seen during the period - captures the worst single spike. | < 160 ms |
| Jitter | Variation between consecutive packets. High jitter is the #1 cause of choppy / robotic audio, even when average ping looks fine. The lower the jitter, the more stable the connection. | < 30 ms |
| Agent IPs | How many different public IPs the agent's device used while connected. More than one usually means a network change mid-shift (Wi-Fi → LTE, VPN reconnect, router reboot). | 1 stable IP |
| PBX Regions | How many different PBX regions served this agent during the period. Switching regions mid-session is rare and usually points to a failover event or a misconfigured region preference. | 1 stable region |
Ping latency on this leg is what the media stream actually has to live with. Values 0–80 ms feel transparent to callers; anything above 160 ms is treated as bad and starts producing audible problems — delay, echo, talk-over.
Health badges
Every user card is tagged with one of three statuses, derived from the metrics above:
- 🟢 Healthy: ping, jitter, and switch counts are all inside the green band.
- 🟡 Degraded: at least one metric is in the warning band (e.g. ping above 80 ms, climbing jitter, or one IP / region switch).
- 🔴 Critical: sustained high latency, very high jitter, repeated IP switches, or repeated PBX-region switches. Calls for this user are very likely affected - investigate.
Chart backgrounds use the same color bands (Good / Warn / Bad), so a spike that crosses into trouble territory is instantly visible.
Filtering the report (Search Params)
| Filter | Purpose |
|---|---|
| Period | Pick the date range to analyze. Only the last 14 days of data are retained - older data is not displayed. |
| Users | Multi-select the agents you want to compare. You can also use Select all to load every user at once. |
| Region | Limit results to one PBX region (for example Europe – Germany 1, Europe – London 1, Europe – London 2) or leave on All. |
| Remote IP (User IP) | Type a public IP and click Add to keep only sessions coming from that IP. Useful for isolating one office, one home worker, or one VPN exit. Multiple IPs can be added. |
Click Generate Chart to (re)render the report with the chosen filters.
Reading a user block
Each selected user gets two stacked elements:
1. Summary card: the health badge plus five KPI tiles:
● Agent1                                              Critical
AVG PING   MAX PING   JITTER   AGENT IPS               PBX REGIONS
107 ms     5103 ms    6.8 ms   5  (1.1.1.1)    2  (Europe – London 1)
2. Detail panel: four time-aligned visualizations of that user's connection to the media server:
- Ping Latency chart: line of avg / max ping over the period, with Good / Warn / Bad bands. Switch annotations (e.g.
agent → 10.20.30.40) appear in-chart at the exact moment they happen. - Jitter chart: variation between successive packets, on the same time axis.
- Agent IP Timeline: a colored bar per public IP the agent used. Each color change is one network switch on the agent's side.
- PBX Region Timeline: a colored bar per PBX region (and IP) that served the agent. Each color change is one region/server switch on the PBX side.
A counter on the right of the block summarizes the activity, for example:
2 agent IPs · 2 switch 1 PBX regions · 0 switch
If you see 5 agent IPs · 8 switch, the agent's network flapped between five IPs eight times during the period — that alone is enough to explain dropped calls and one-way audio.
Example to health connection
Example to possible network issues
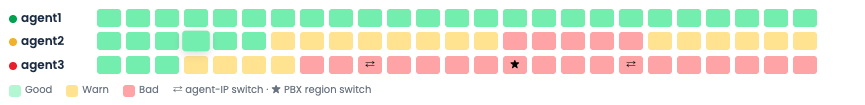
The overview heatmap
At the bottom of the report there is a heatmap of all selected users vs. time. Each row is one user; each cell is one time bucket colored Good / Warn / Bad. Two icons can appear inside a cell:
- ⇄ agent-IP switch: the agent's public IP changed during that bucket.
- ★ PBX region switch: the user's calls moved to a different PBX region during that bucket.
This view is the fastest way to find "who had a bad day" across an entire team in one screen - red blocks and ★ markers jump out immediately.
Benefits
- Faster triage of call-quality tickets. Open the report, find the agent, and you instantly know whether the issue is on the agent-to-PBX leg (latency / jitter / IP flapping / region switching) or somewhere else in the chain.
- Proactive monitoring. The Healthy / Degraded / Critical badges, plus the team-wide heatmap, let leads scan dozens of agents without opening any single card.
- Pinpoint the root cause. Ping and jitter charts share the same time axis as the IP and PBX-region timelines, so a latency spike that lines up with an
agent → new-IPannotation is an obvious "agent's network changed" story - no log diving required. - Office vs. home visibility. The Remote IP and Region filters isolate a single site, a specific home worker, a VPN exit, or one media server at a time.
- Catch failover events. PBX Region switches show clearly when an agent's calls moved between media servers - useful for verifying region preferences and for post-mortems after an incident.
- Evidence you can share with the agent. The summary card and timelines are a clear, time-stamped record of what happened, in language a non-engineer can understand.
Examples
The examples below use real data observed in the report.
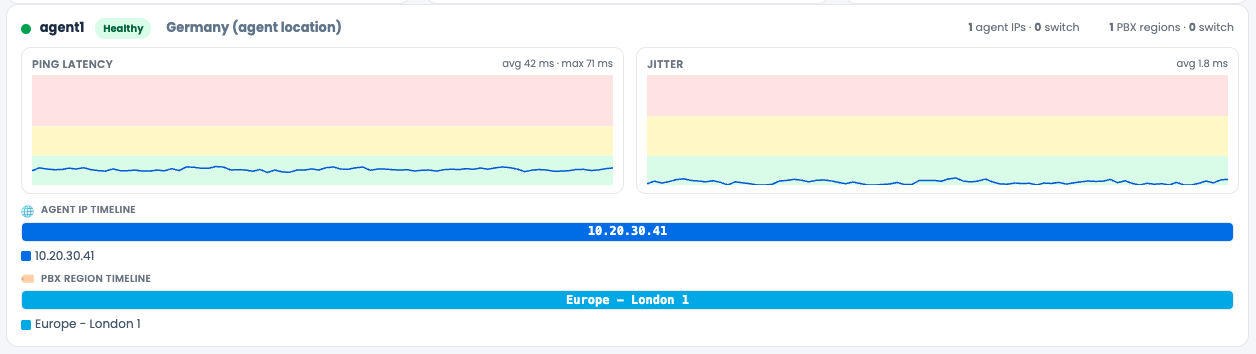
Example 1: A healthy agent
● admin                                                   Healthy
AVG PING 0 ms   MAX PING 0 ms   JITTER 0.0 ms   AGENT IPS 0   PBX REGIONS 0
No calls during the period, or a perfectly stable session: charts stay in the green band, timelines are flat, and both switch counters are zero. Nothing to do.
Example 2: Borderline (Degraded)
● testuser1                                                Degraded
AVG PING 51 ms   MAX PING 132 ms   JITTER 6.9 ms
AGENT IPS 1 · 10.20.30.40       PBX REGIONS 1 · Europe – London 1
Average ping is still in the green range but max ping is 132 ms — crossing into the warn band. Identity is stable (one IP, one region). The agent will hear occasional small audio glitches but calls are generally usable. Worth keeping an eye on; if it gets worse, ask the agent about their local network conditions.
Example 3: Critical, sustained latency spikes
● Agent1                                                 Critical
AVG PING 107 ms   MAX PING 5103 ms   JITTER 6.8 ms
AGENT IPS 5                          PBX REGIONS 2 · Europe – London 1
Average ping above 100 ms, max ping above 5 seconds, five different agent IPs, two PBX regions in play. The Agent IP Timeline will show several color changes; the Ping chart will have tall red spikes annotated with agent → <new IP> at exactly those moments. This is an unstable agent network combined with at least one region switch - the agent's calls are almost certainly affected. Recommendation: switch the agent to a wired/stable connection and confirm their assigned region preference.
Example 4: Pure jitter problem (Agent2)
● Agent2                                             Critical
AVG PING 71 ms   MAX PING 12321 ms   JITTER 20.6 ms
AGENT IPS 2 · 10.20.30.50           PBX REGIONS 1 · Europe – London 1
Average ping looks acceptable, but jitter is over 20 ms and max ping briefly exceeds 12 seconds - the classic profile of an overloaded uplink. The agent will hear robotic / chopped audio even though "the connection feels fine" from a browser-speed-test point of view. Action: investigate the agent's local network for bandwidth contention (large downloads, video calls on the same line).
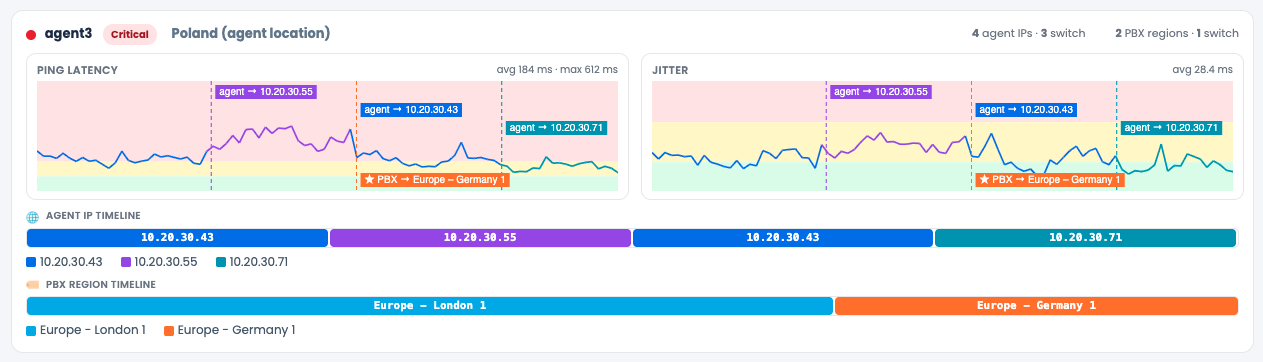
Example 5: Region switch in the middle of a session (agent)
● Agent3                                                    Critical
AVG PING 63 ms   MAX PING 2100 ms   JITTER 2.3 ms
AGENT IPS 2 · 2 switch               PBX REGIONS 1 · 0 switch
In the chart you can see annotations like agent → 10.20.30.40 and agent → 10.20.… at specific timestamps, with both IPs (10.20.30.40 and 10.20.30.50) appearing on the Agent IP Timeline. Even though the PBX region itself didn't change, the agent's device hopped between two networks twice — every hop is a brief moment of audio loss. The fix is on the agent's side: pick one stable network and stay on it.
Example 6: Investigating a one-off complaint
A customer reports "the call cut out around 14:32 yesterday". Open Agent Devices Connection Status, set Period to that day, leave only the relevant agent selected, click Generate Chart, and look at the Ping chart at 14:32. A red spike there, especially if it lines up with a color change on the Agent IP Timeline or a ★ marker in the team heatmap, tells you exactly what happened in under a minute, with evidence you can paste into the ticket.
Tips
- Keep the Users list short (5–8 agents) for readable per-user charts. Use Select all if you only need the team-wide heatmap at the bottom.
- Combine this report with Network Stats (browser ↔ app over WebSocket) and Region Registration Users for a full picture: app side, voice side, and SIP registration side.
- Compare bad agents against good ones in the same region - if everyone in Europe – London 1 spikes at the same time, the issue is regional, not per-agent.
- Data is retained for 14 days only. Export or screenshot anything you need to keep for longer.
- An IP switch once during a long shift is normal. A pattern of repeated ⇄ markers in the heatmap is your action item.
- The legacy view is still accessible via Switch to legacy view at the top of the table.
Region Registration Users
The Region Registration Users tab (Dialer → Reports → Network Stats → Region Registration Users) is the real-time view of who is currently registered to each PBX region. While the previous two tabs answer "how is the connection performing over time", this tab answers a more immediate question: right now, who is connected, where are they connected, and is their link healthy?
It is the first place to look when:
- An agent says "I'm online" but the dialer says they aren't, you can confirm whether their device is actually registered.
- You suspect users are landing on the wrong PBX region.
- You need to verify the source IP or country of a registration.
- You want a per-region snapshot of who is live and how good their connection is at this very moment.
NOTEThis view is live. There are no date filters and no charts, every row is the current state of a registration on a PBX region.
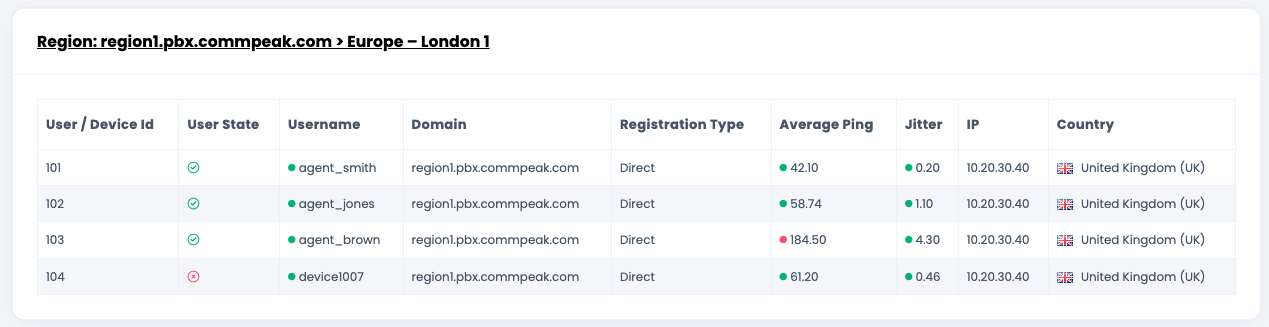
What the report shows
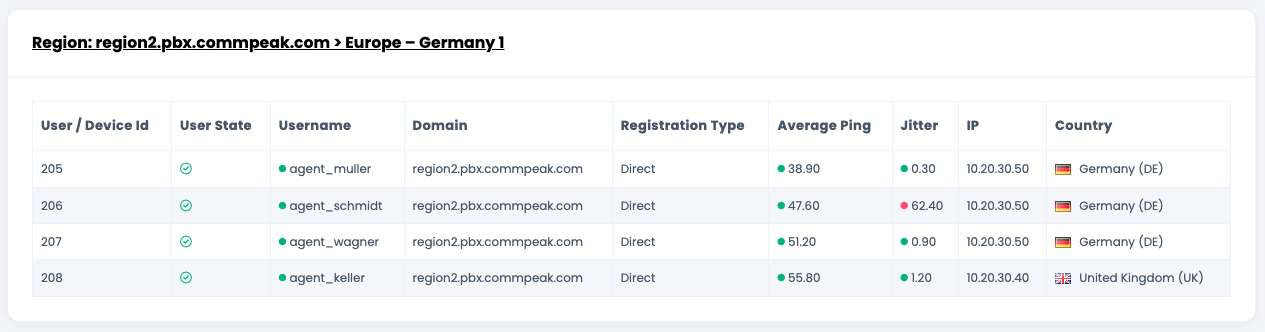
The page is split into one section per PBX region (for example Region: region1.pbx.commpeak.com > Europe – London 1), each containing a table of every user/device currently registered to that media server.
For each registration you get:
| Column | Description |
|---|---|
| User / Device Id | The internal user or device ID inside the Dialer. |
| User State | A green ✓ if the user is allowed/active, a red ✕ if the user is currently blocked or disabled. This is the account-level status, independent of network quality. |
| Username | The username, prefixed with a green dot when the registration is live. |
| Domain | The PBX domain the user is registered against (for example region1.pbx.commpeak.com). |
| Registration Type | How the user is connecting - typically Direct for a directly-registered softphone/agent. |
| Average Ping | Current average round-trip time, in milliseconds, between the user and the PBX media server. Color-coded: green dot = good, red dot = bad. |
| Jitter | Current jitter in milliseconds. Same green/red color coding as Average Ping. |
| IP | The public IP the registration is coming from. |
| Country | The country (with flag) detected from that IP, useful for spotting unexpected geographies. |
Health thresholds used on this page
| Metric | Good (green) | Bad (red) |
|---|---|---|
| Average Ping | 0–80 ms | > 160 ms |
| Jitter | 0–21 ms | > 50 ms |
Ping is the time it takes a packet to travel from the PBX region to the user and back. High latency causes audible delay, echo, and buffering. Jitter measures how consistent that latency is - packets arriving at irregular intervals are the main cause of choppy / robotic audio, even when average ping looks fine. The lower the jitter, the more stable the connection.
Benefits
- Live confirmation of who is online. One glance per region tells you exactly which users/devices are registered right now, no log digging.
- Catch wrong-region registrations. If an agent who should be on London 1 shows up under Germany 1 (or vice versa), it's visible immediately - and the source IP + country column usually explains why.
- Pinpoint blocked users. The User State column flags accounts that are disabled at the platform level, separately from network quality. This is how you tell "the agent can't log in" apart from "the agent's audio is bad".
- Real-time health, not historical. The colored Average Ping and Jitter dots let you spot, at this moment, which registered users have a degraded path to their media server.
- Geo sanity check. The Country column (with flag) catches obvious oddities like a "home worker in country A" registering from country B useful for both troubleshooting and compliance.
Examples
Example 1: A healthy registration
User Id : 111
State   : ✓
Username: ● agent_smith
Domain  : region1.pbx.commpeak.com
Reg.    : Direct
Avg Ping: 59.69 ms     (green)
Jitter  : 0.03 ms      (green)
IP      : 10.20.30.40
Country : 🇬🇧 United Kingdom (UK)
User is registered, latency is well inside the good band, jitter is effectively zero, country matches the expected location. Nothing to do.
Example 2: Account blocked, network fine
User Id : 1007
State   : ✕         ← red mark
Username: ● device1007
Domain  : region2.pbx.commpeak.com
Avg Ping: 69.97 ms  (green)
Jitter  : 0.46 ms   (green)
IP      : 10.20.30.50
Country : 🇩🇪 Germany (DE)
The device is registered and the network looks fine, but the user is in a not clocked in / disabled state at the platform level. If the agent complains they can't take calls, this is your answer - it's an account issue, not a network issue.
Example 3: Confirming an agent is actually online
A team lead says "agent X tells me they're logged in, but their phone keeps ringing out". Open Region Registration Users and look for that username under any region.
- If the row is there with a green dot and green Avg Ping / Jitter, the agent is registered and reachable. The problem is elsewhere (status, queue assignment, routing).
- If the row is missing, the agent's softphone is not registered to any PBX region. The agent needs to re-open the dialer or check their local network - there is nothing to route calls to right now.
Example 4: Wrong region / wrong country
If you expect all your users to register on region1.pbx.commpeak.com (UK) but you see a row for one of them under region2.pbx.commpeak.com (Germany), or a Country flag that does not match where the user actually works, you've found a routing or VPN misconfiguration. Use the IP and country columns to figure out which path the user is actually taking, then fix their region preference (or their VPN) accordingly.
Tips
- This page is live, refresh it to get the current state. There is no historical mode here; use Network Stats or Agent Devices Connection Status for trend data.
- Use it in combination with the other two tabs: Agent Devices Connection Status tells you how the agent-to-PBX leg has performed; Region Registration Users tells you whether the agent is actually registered right now, and where.
- The Average Ping / Jitter dots are the fastest at-a-glance signal: all green = healthy region; any red dot = a user worth investigating immediately.
- A user who appears with a red ✕ in User State but green ping/jitter is registered and reachable but blocked - investigate at the user/account level, not the network level.
Updated about 2 months ago