

Dialer Dashboard
This article overviews the CommPeak Dialer dashboard, including stat cubes, charts, time frames and filters, and how to customize your layout.
The dashboard is your homepage in CommPeak Dialer. It offers an easy view of call and agent activity, and it can be configured to show the metrics and charts you choose, over the time frame you set, and arranged the way you like.
To open your Dashboard:
- Open your CommPeak Dialer instance.
- Click the Dialer icon at the top left.
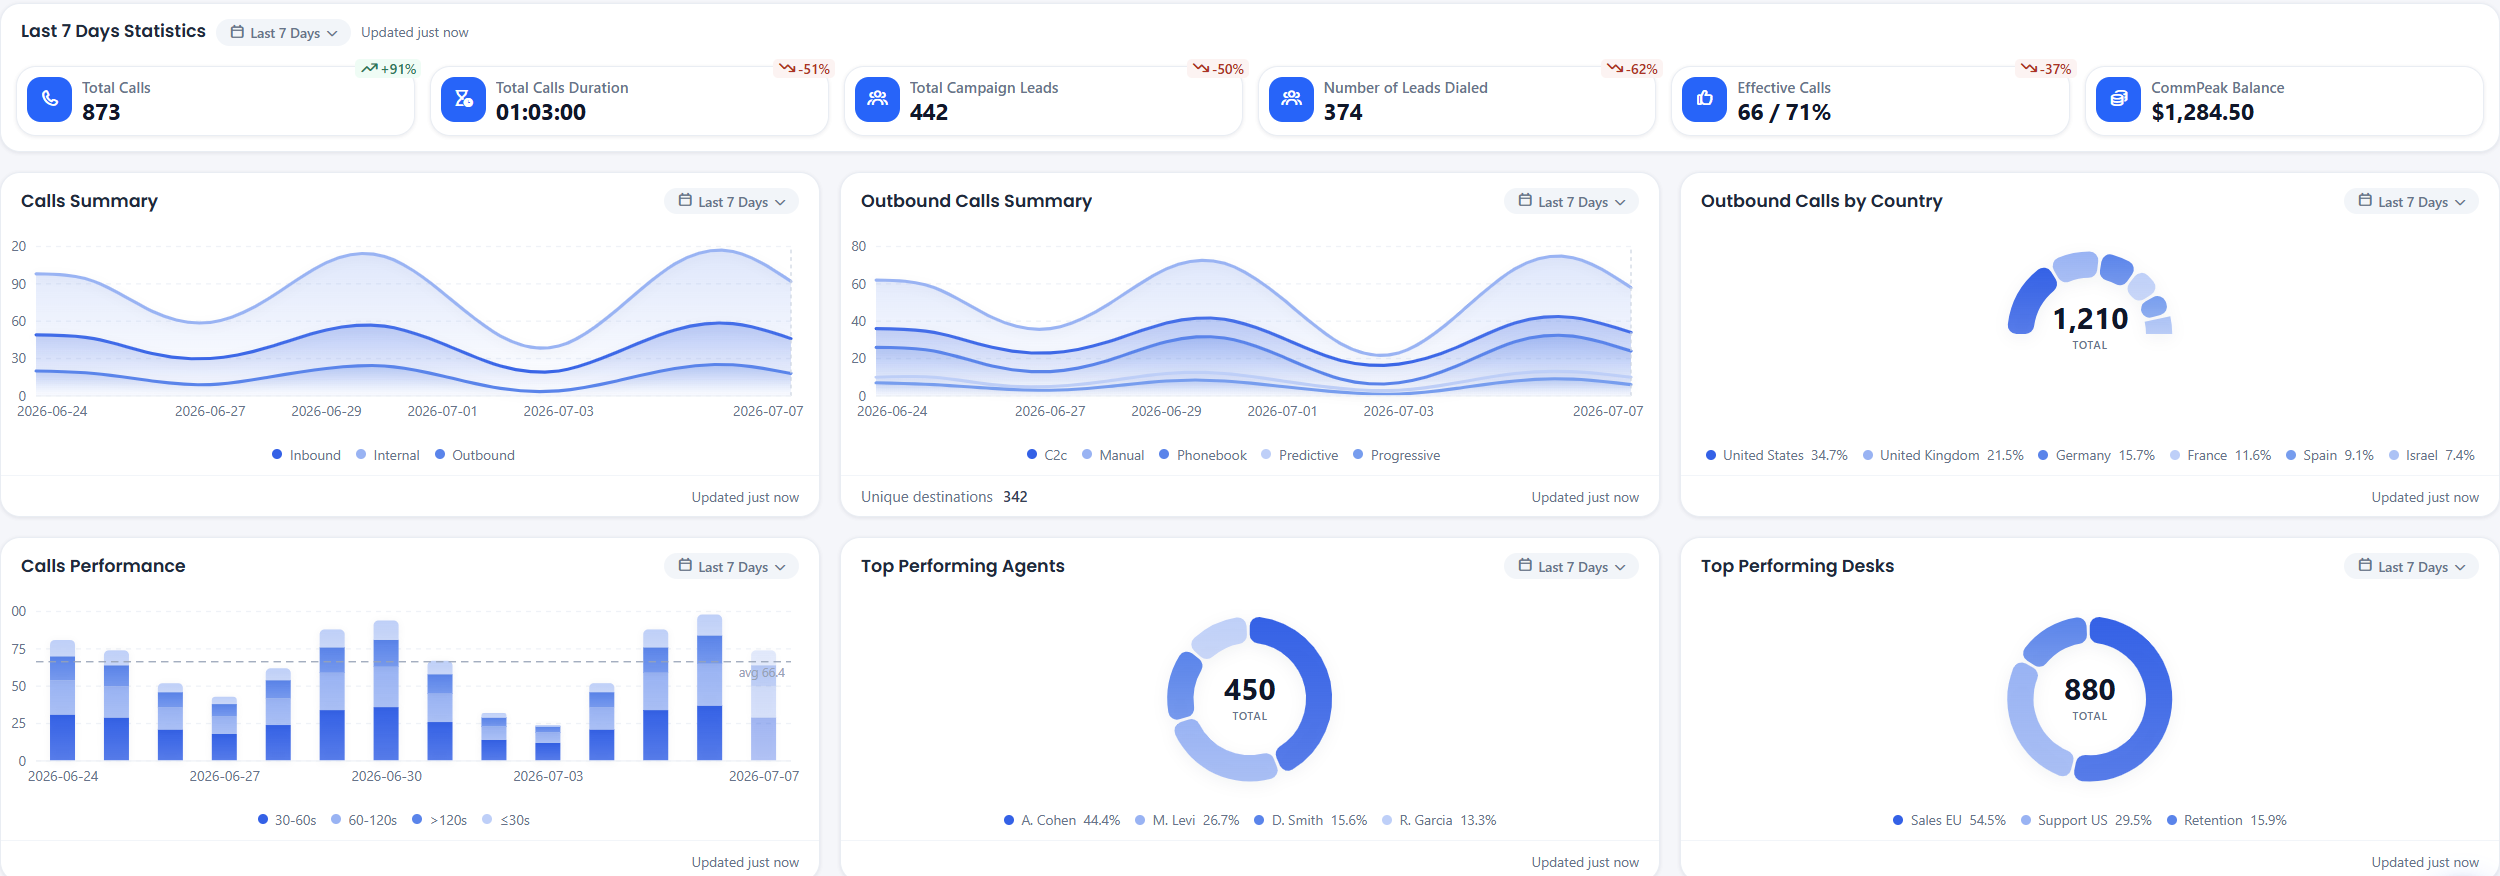
The CommPeak Dialer dashboard
Manager vs. Agent dashboard
Your dashboard type depends on your account permissions:
- Manager Dashboard: Shows activity across the manager's whole team (agents, desks, campaigns) and includes the full set of metrics
- Agent Dashboard: Focuses on the agent's personal stats with a smaller set of metrics
Both dashboards share the same layout, charts, time-frame controls, and customization tools. The only difference is which stat cubes you can add. The Available to column in the Stat cubes reference shows whether a cube appears on the Manager dashboard, the Agent dashboard, or both. Note that two cubes use a different label depending on the dashboard.
Charts are controlled separatelyCharts are not tied to the manager/agent split. They're governed by a single 'view dashboard charts' permission, so either dashboard type can show charts when that permission is enabled. See the Charts reference.
Dashboard permissions
Your role decides which dashboard you get:
- You get the Manager Dashboard if your role has the Manager Dashboard permission (under Home Page Dashboards → Homepage Widgets), if your account is a Tenant Superuser, or if it has the Full Recording Access flag
- Otherwise, with the Agent Dashboard permission, you get the Agent dashboard
- If your account has both permissions, the Manager dashboard always takes precedence
How the dashboard is organized
The dashboard is built from three kinds of building blocks:
Stat cubes: Single-number tiles (KPIs) such as Total Calls or Average Success Rate, grouped into panels.
Charts: Trends and breakdowns such as Calls Summary or Outbound Calls by Country
Tools: the My Future Callbacks list and blank Metrics panels you fill yourself
Reading a stat cube
Each cube shows a single value for the panel's time frame. Many cubes also show a change chip that compares the value to the previous, equivalent period: green for an increase, red for a decrease.
Every panel has its own controls in the top-right of its header:
- A time-frame button (e.g. Today, Last 7 Days) that sets the period and filters for that panel only
- An Updated label showing how fresh the data is (e.g. just now, 5m)
Reading the charts
Charts cover the same period as their panel's time-frame button. For Today or Yesterday, category charts appear as donuts. For multi-day ranges, they appear as trends over time. Hover over any point or segment to see the exact values.
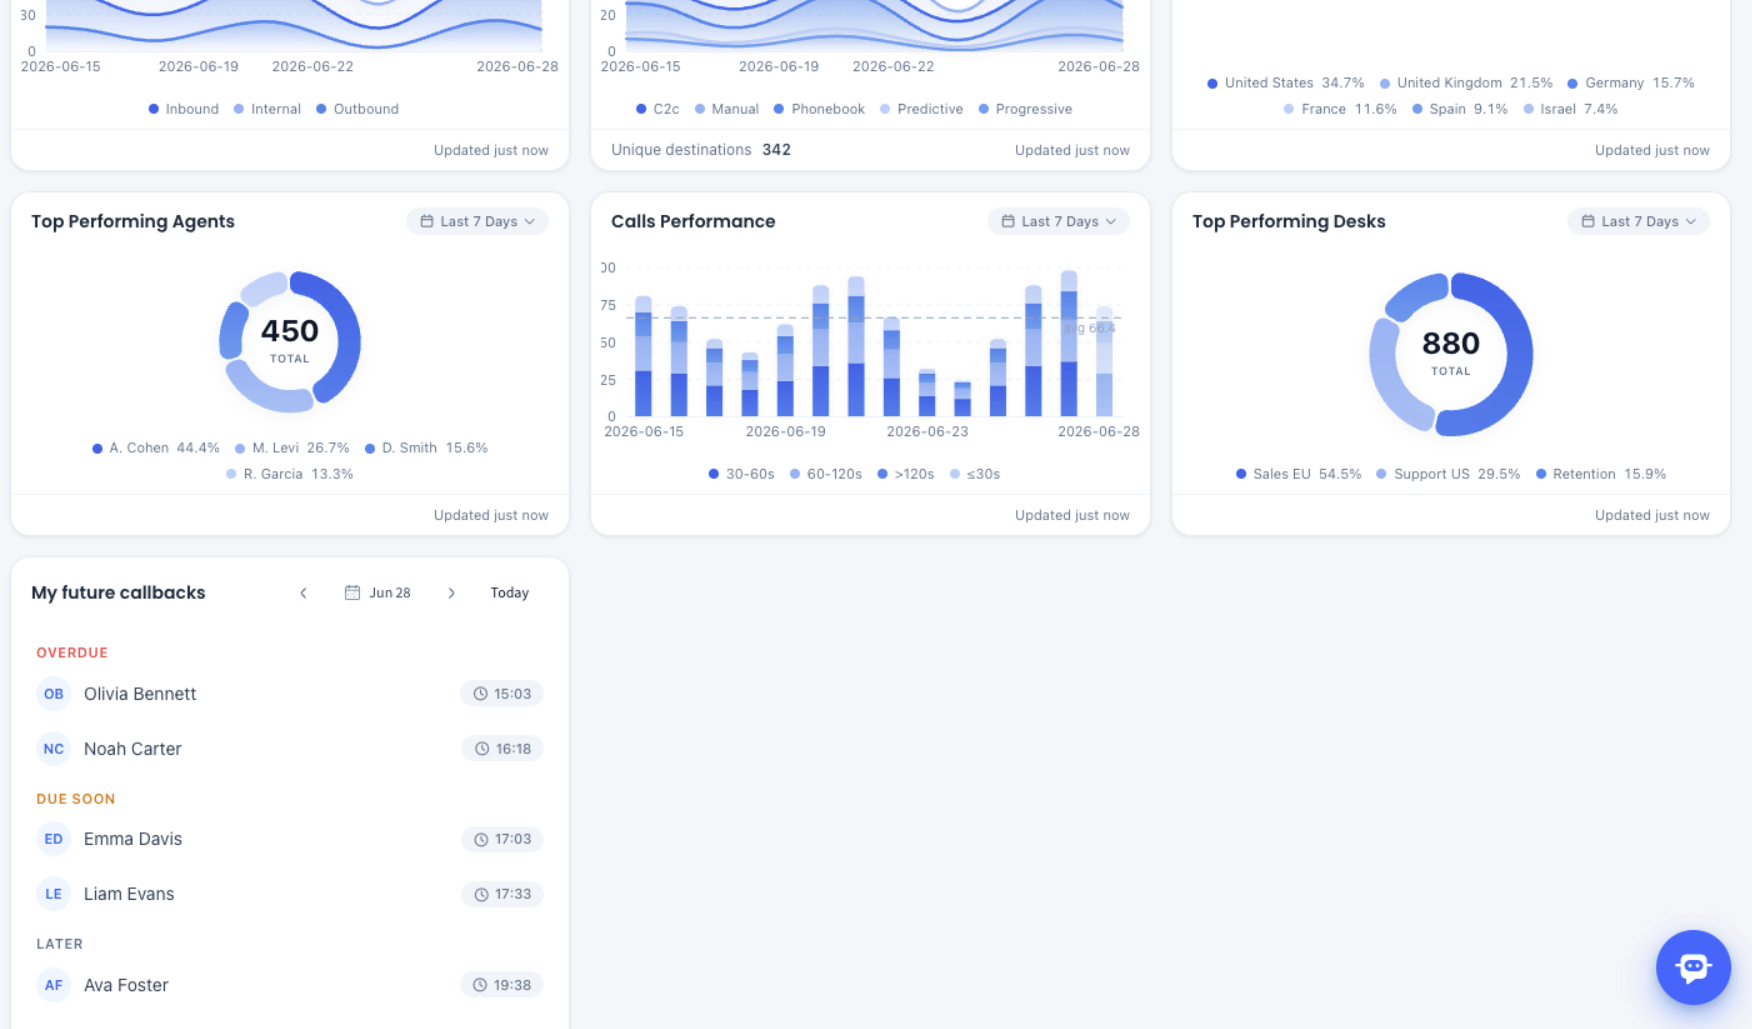
Charts and the My Future Callbacks list
My future callbacks
The My Future Callbacks list shows the leads you've scheduled to call back, grouped by urgency: Overdue, Due Soon, and Later. Use the date arrows to move between days, or click Today to jump back. Click any lead to open it.
Stat cubes reference
The table below describes what each cube shows and which dashboard it is available on. Durations are shown as HH:MM:SS, and "answered" means a call that connected (had billable talk time).
Calls
| Cube | What it shows | Available to |
|---|---|---|
| Total Calls | All calls handled in the selected period, including inbound, outbound, and internal calls | Manager & Agent |
| Incoming Calls | Inbound calls received | Manager |
| Total Predictive Calls | Calls placed by the predictive dialer | Manager |
| Total Progressive Calls | Calls placed by the progressive dialer | Manager |
Call duration
| Cube | What it shows | Available to |
|---|---|---|
| Total Calls Duration | Total time spent on all calls | Manager & Agent |
| Total Billable Calls Duration | Total talk time on answered (billable) calls | Manager & Agent |
| Total Predictive Duration | Time spent on predictive calls | Manager |
| Total Progressive Duration | Time spent on progressive calls | Manager |
| Average Call Duration (ACD) | Average length of a call | Manager |
Answered & effectiveness
| Cube | What it shows | Available to |
|---|---|---|
| Answered Calls (agent) / Total Billable Calls (manager) | Number of calls that connected. Same metric, labeled per dashboard | Manager & Agent |
| Total Billable Predictive | Connected predictive calls | Manager |
| Total Billable Progressive | Connected progressive calls | Manager |
| Effective Calls | Calls that lasted at least your configured threshold, shown as a count and a percentage of total calls | Manager |
| Average Success Rate (ASR) | Percentage of calls that were answered | Manager |
Leads
| Cube | What it shows | Available to |
|---|---|---|
| Personal Leads (agent)/Number of Leads Dialed (manager) | Distinct leads that were dialed. Same metric, labeled per dashboard | Manager & Agent |
| Total Answered Leads | Distinct leads that were reached (had at least one connected call) | Manager |
| Total Campaign Leads | Total number of leads in the selected campaigns | Manager |
| Total Assigned Leads | Leads assigned or created during the period | Manager |
| Count Of The Specific Status | Number of calls that ended in the lead status(es) you choose | Manager |
| Average Calls Per Same Leads | Average number of calls made per lead | Manager |
Agents & time
| Cube | What it shows | Available to |
|---|---|---|
| Log-In Duration | Total time logged into the system | Manager & Agent |
| Clock-In Duration | Total clocked-in (shift) time | Manager & Agent |
| Breaks Amount | Number of break sessions taken | Manager & Agent |
| Total Breaks Duration | Total time spent on breaks | Manager & Agent |
| Meetings For Today | Number of callbacks scheduled for today | Manager & Agent |
| Total Users | Number of agents who made or received calls | Manager |
Account
| Cube | What it shows | Available to |
|---|---|---|
| CommPeak Balance | Your account's live Voice balance (and SMS balance, where available) | Manager (with balance permission) |
Charts reference
Charts appear on either dashboard type when the "view dashboard charts" permission is enabled. The Best for column notes whether a chart describes team-wide activity or your personal activity.
| Chart | What it shows | Best for |
|---|---|---|
| Calls Summary | Inbound vs. outbound vs. internal call volume over time | Team or personal |
| Outbound Calls Summary | Outbound volume split by dialing mode (manual, predictive, progressive, click-to-call, phonebook), with the number of unique destinations | Team or personal |
| Outbound Calls by Country | Where your outbound calls land, broken down by country | Team or personal |
| Billable Calls | Billable amount by dialing mode | Team or personal |
| Calls Performance | Calls grouped into duration buckets (≤30s, 30–60s, 60–120s, >120s) | Team or personal |
| Inbound Summary | Bridged vs. abandoned inbound calls | Team or personal |
| Top Performing Agents | Your highest-volume agents | Team (manager) |
| Top Performing Desks | Your highest-volume desks (teams) | Team (manager) |
| My Calling Performance | Total vs. effective calls over time | Personal (agent) |
| Answer Rate / Total Outbound | Outbound call volume together with answer rate | Team or personal |
| Total Inbound / Answered | Share of inbound calls that were answered | Team or personal |
| Total Outbound / Answered | Share of outbound calls that were answered | Team or personal |
Setting the time frame & filters
Click a panel's time-frame button to open its view options. From there you can:
- Choose the time frame (Today, Yesterday, This/Last Week, This/Last Month, Last 7/30 Days)
- Narrow the data by Groups, Skill Groups, Desks, and Campaigns
These settings apply to that panel only. A change you make here is temporary until you save it. Click Save as default to keep it.
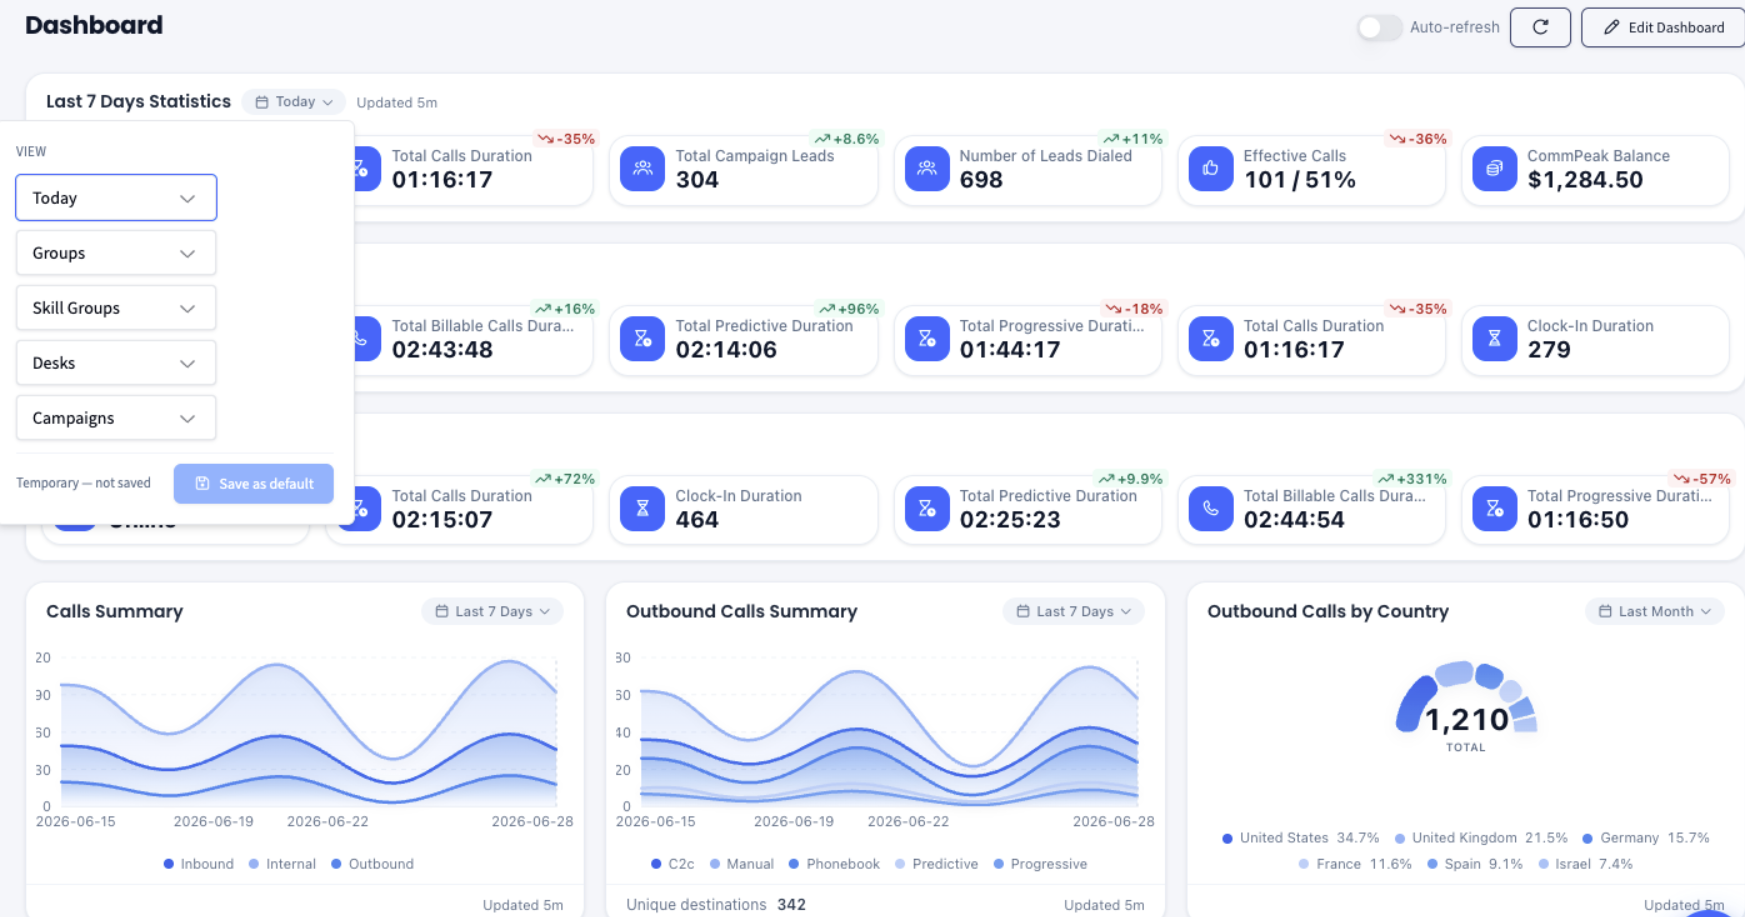
Per-panel time frame and scope filters
Keeping data Fresh
Refresh: Click the refresh button (top right) to reload all panels immediately.
Auto-refresh: Turn on the toggle to refresh the dashboard automatically. Each panel shows an Updated label so you always know how current the data is.
Customizing your dashboard
Click Edit Dashboard (top right) to enter edit mode. While editing, each panel shows controls to configure, duplicate, or remove it, and each cube shows a remove button.
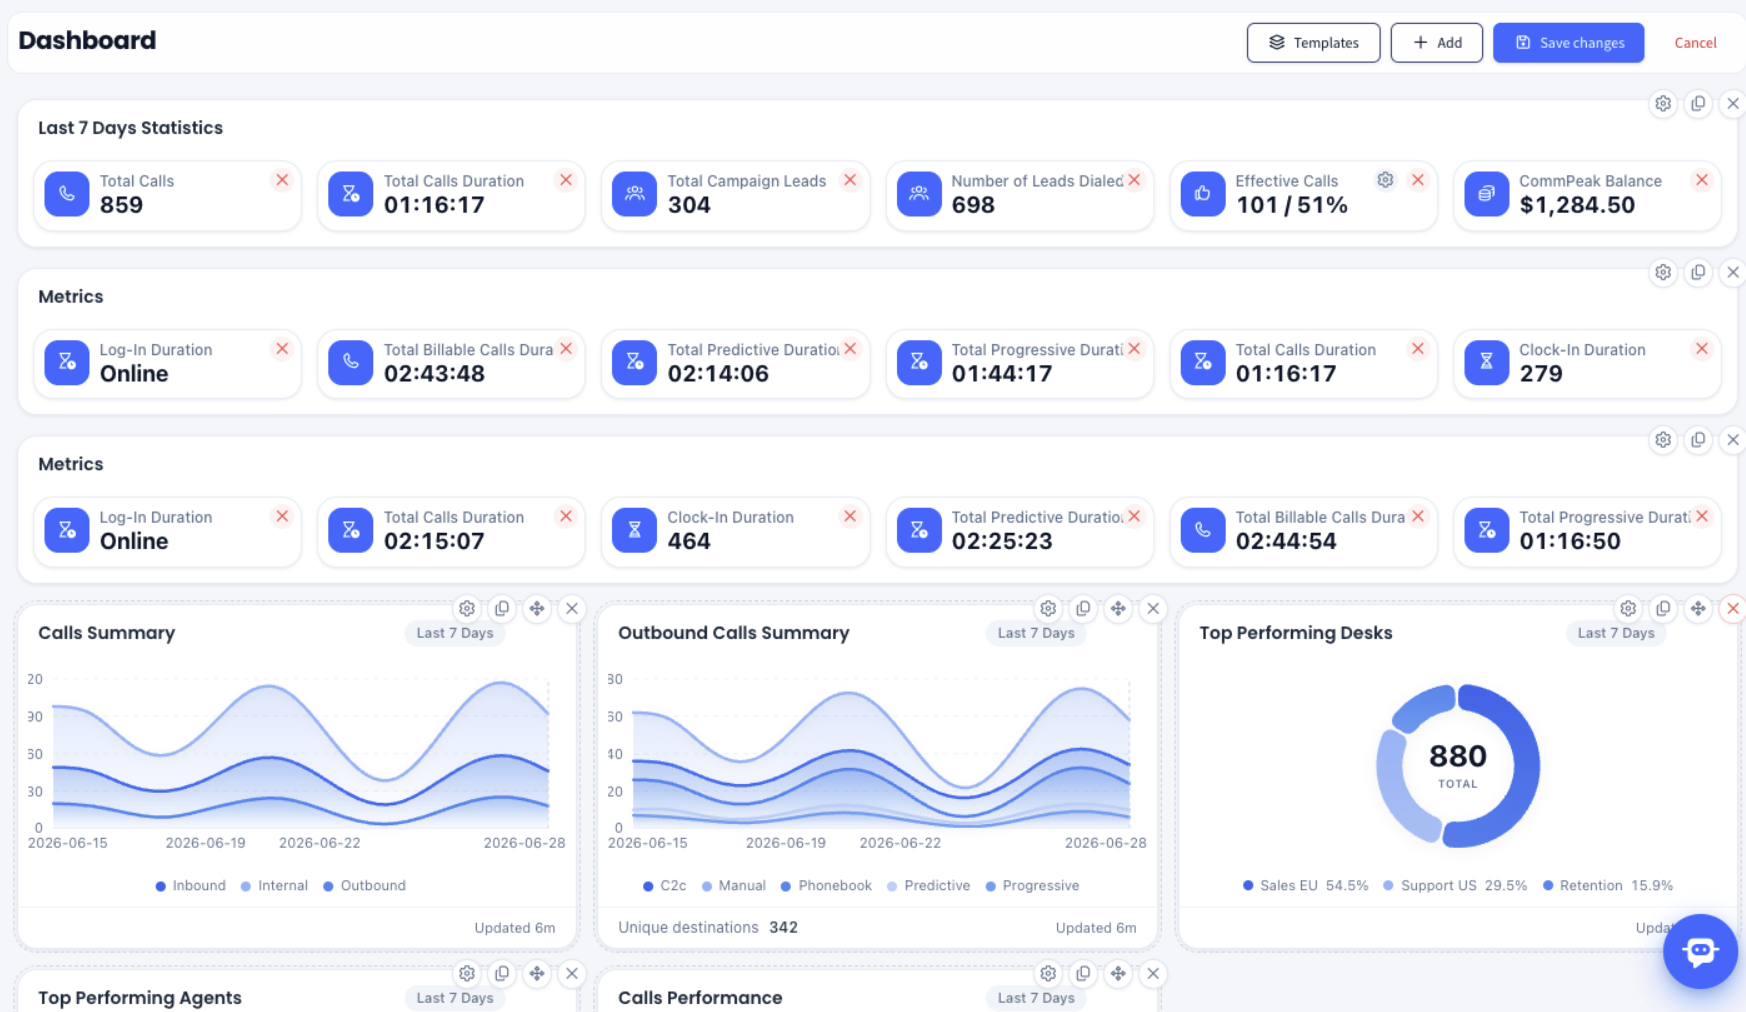
Edit mode - panel and widget controls
Add panels, charts, and tools
Click Add to open the picker. Search for an item, or browse the Charts and Tools groups. The Preview panel on the right shows what it looks like before you add it. Click Add to dashboard to place it. The cubes and charts offered here match what your permissions allow.
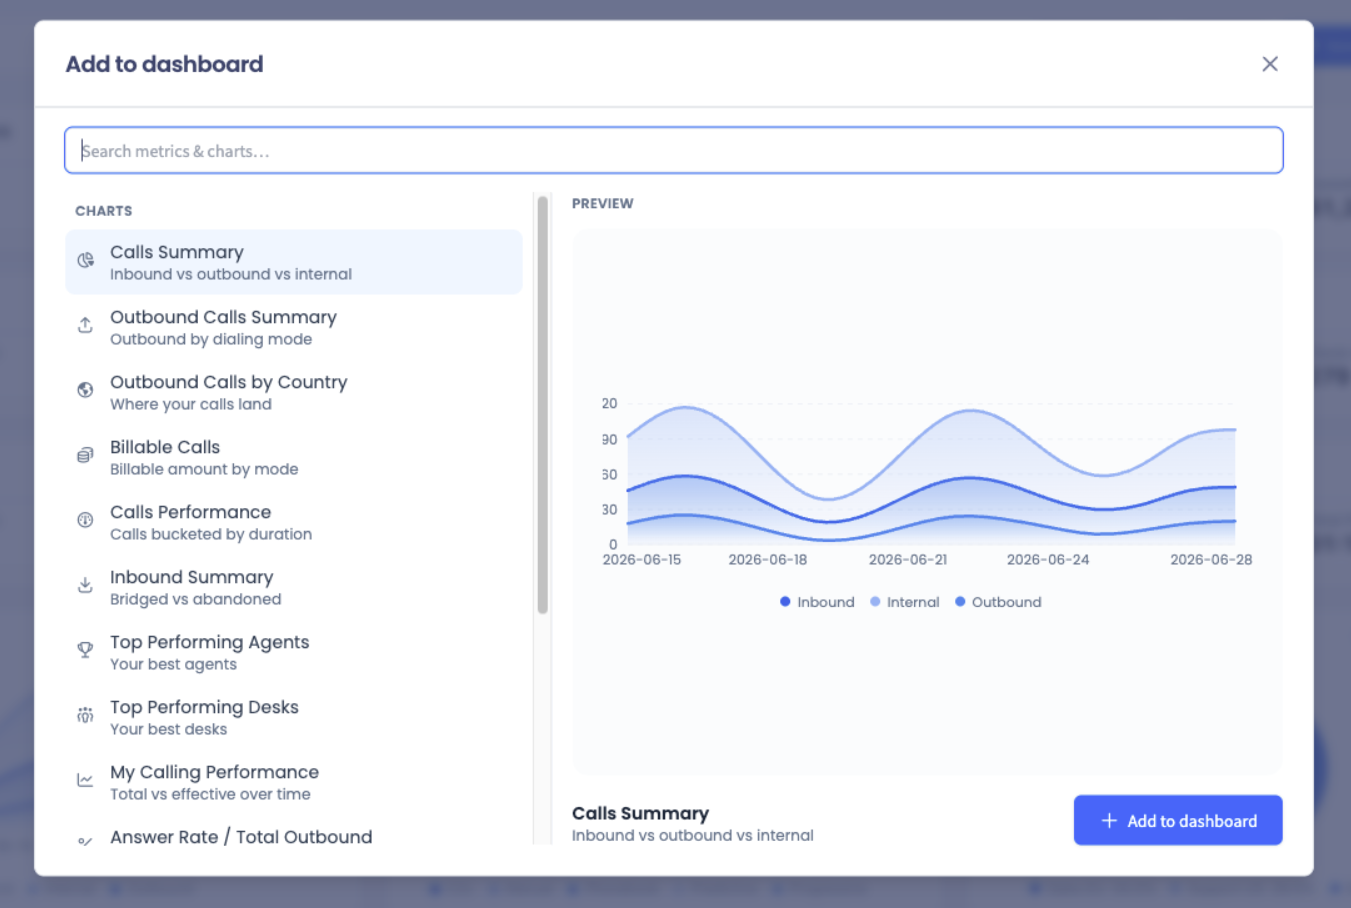
Adding a chart from the picker, with live preview
Configure a cube
Some cubes have their own settings. For example, Effective Calls lets you set the Effective Call threshold (in seconds) that decides which calls count as effective. Open the cube's settings, enter a value, and click Apply.
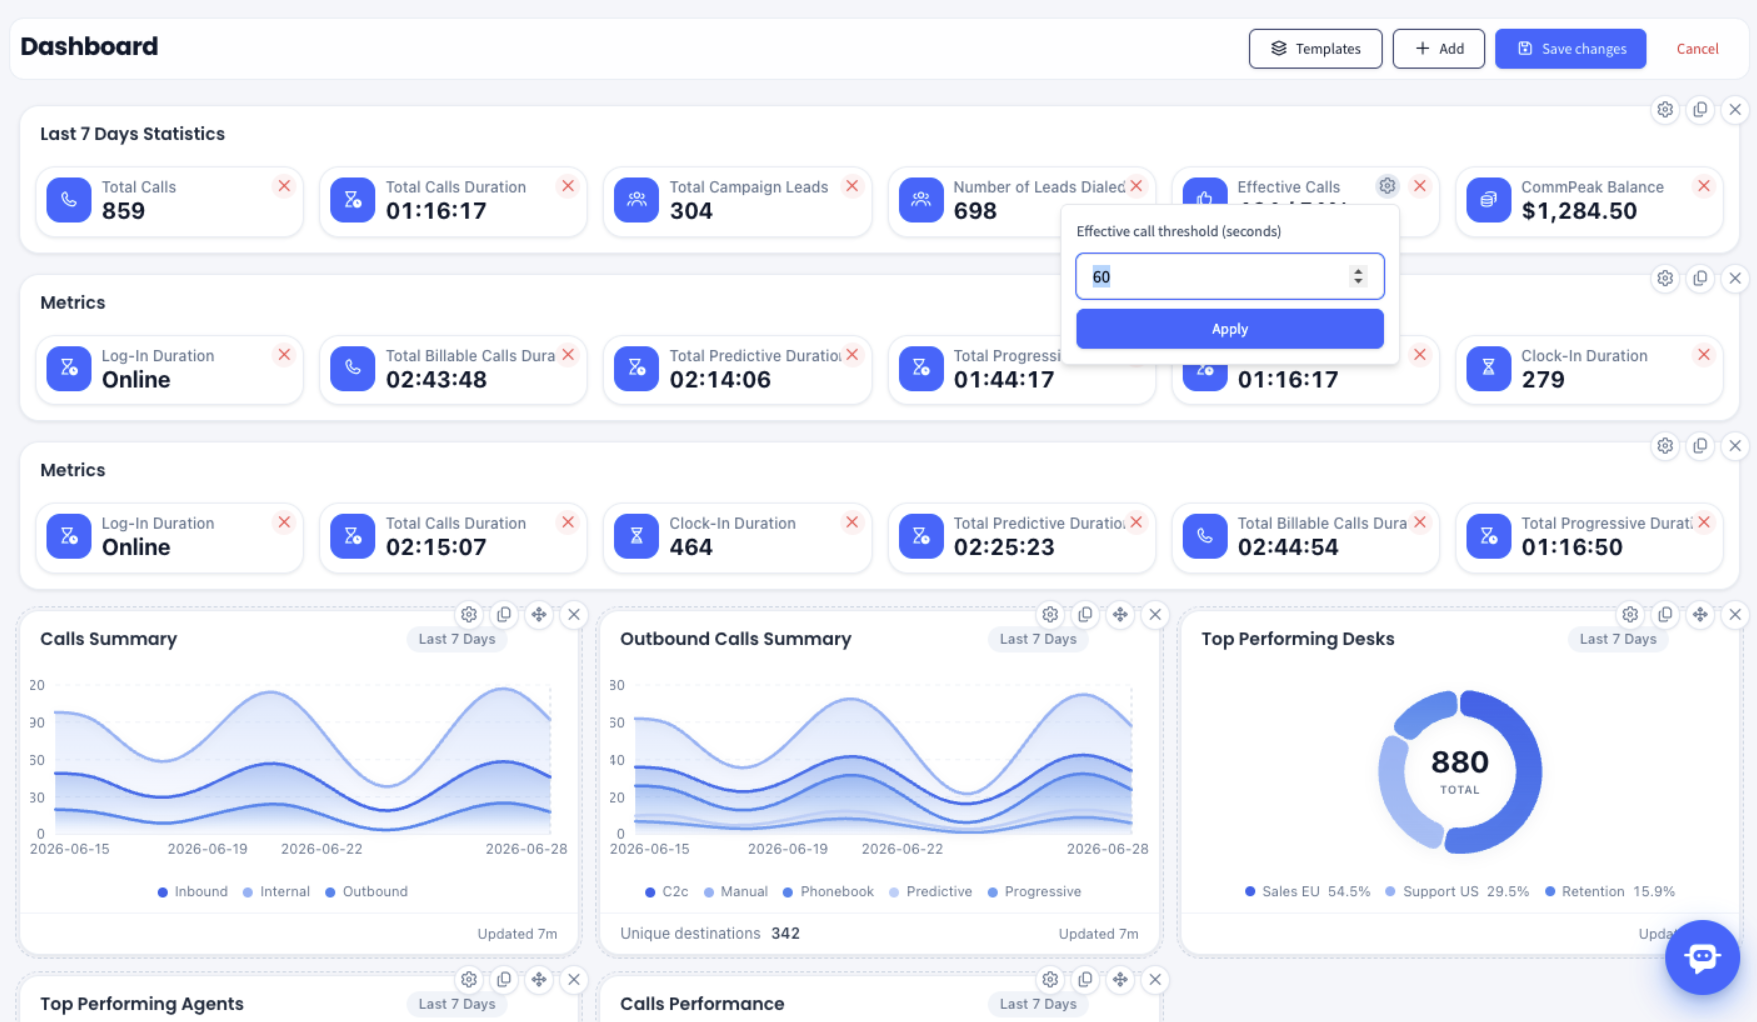
Configuring a cube — the Effective Calls threshold
Rearrange, duplicate, and remove
Move: Drag a panel by its handle to reposition it
Resize: Drag a panel's edge to change its size
Duplicate: Copy a panel, including its settings
Remove: Delete a panel, or remove a single cube from a panel
Start from a template
Click Templates to replace your current layout with a ready-made one: Manager Command Center, Inbound Operations, Outbound & Revenue, Executive Snapshot, Agent Day, or Compact. Nothing is saved until you click Save changes. Cancel restores your previous layout.
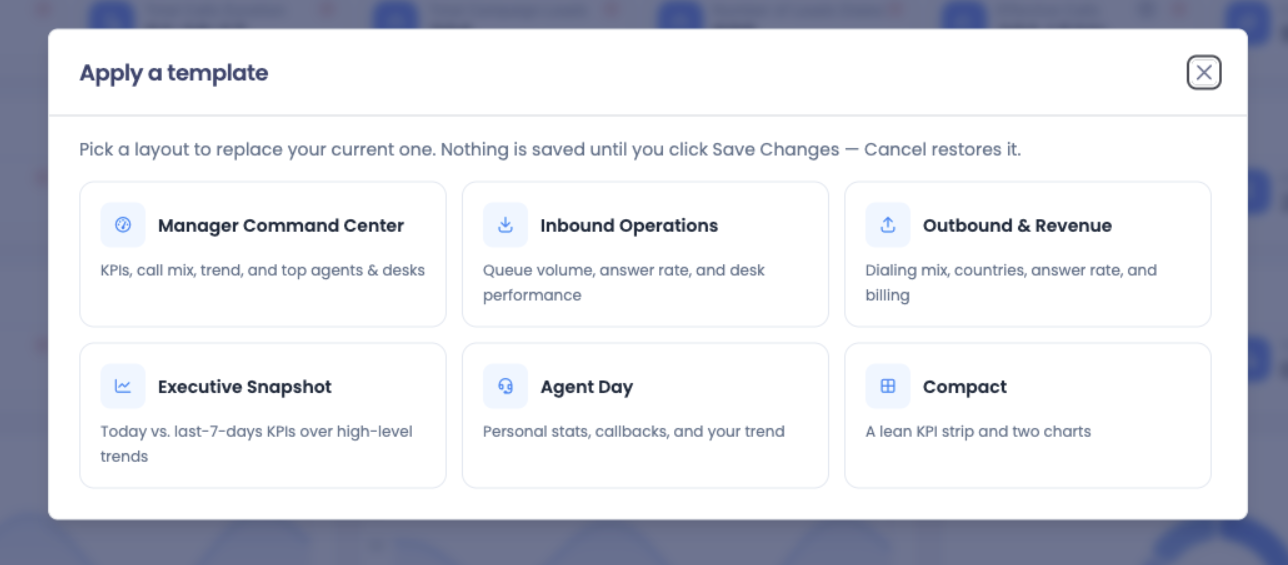
Prebuilt Dashboard Templates
Save your changes
When you're happy with the layout:
Save changes: Keep your edits as your dashboard.
Cancel: Discard your edits and restore the previous layout.
Updated 2 days ago