Stats by Queue
Generate and customize queue reports in PBX Stats. View detailed statistics on call types, agent performance, and SLAs, with options to filter, save, and schedule reports.
The Stats by Queue tab shows statistics of the selected incoming calls queue.
Stats by Queue page
Stats by Queue includes statistics distributed by queue, month, week, day, hour, and weekday. Click Show/Hide contents menu to show Navigation and quickly get to the needed statistics.
To run the report:
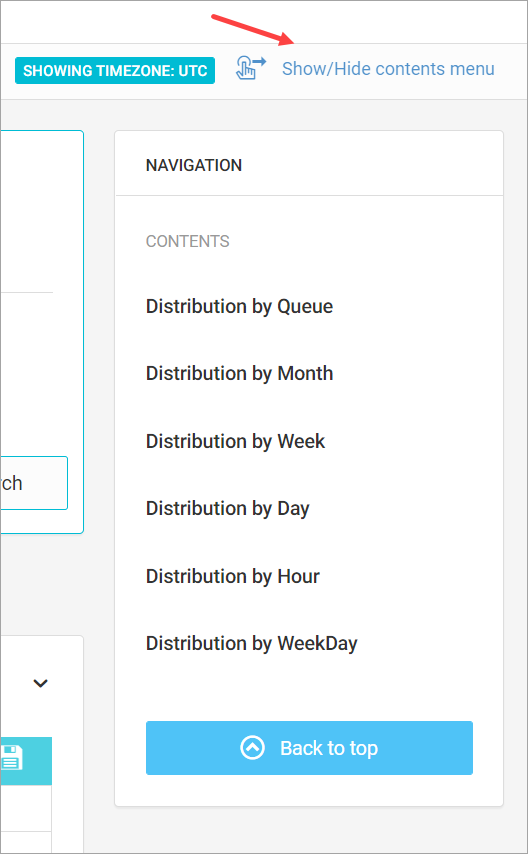
Show/Hide contents menu option
-
Log in to PBX Stats and go to the Stats by Queue tab.
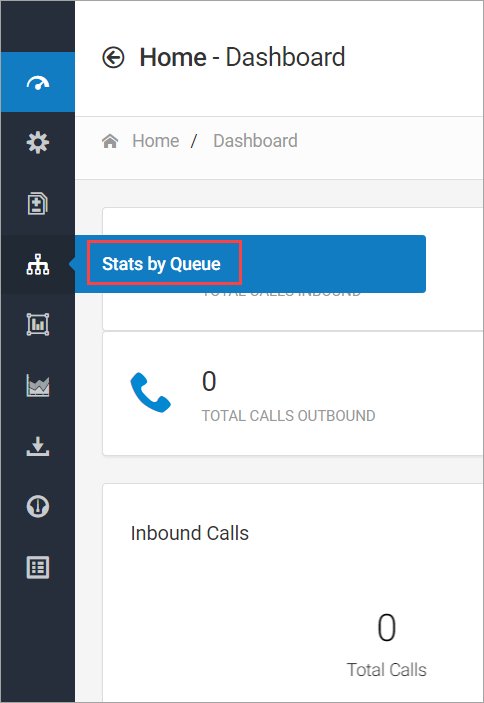
Stats by Queue tab
To expand the menu on the left, click the collapsed menu icon.
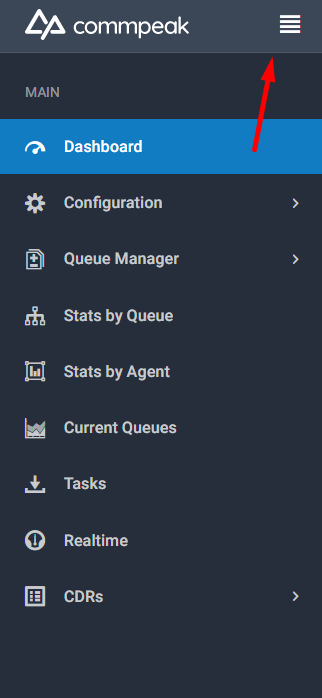
Collapsed menu icon
-
Set the necessary filters in the Search Filter section.
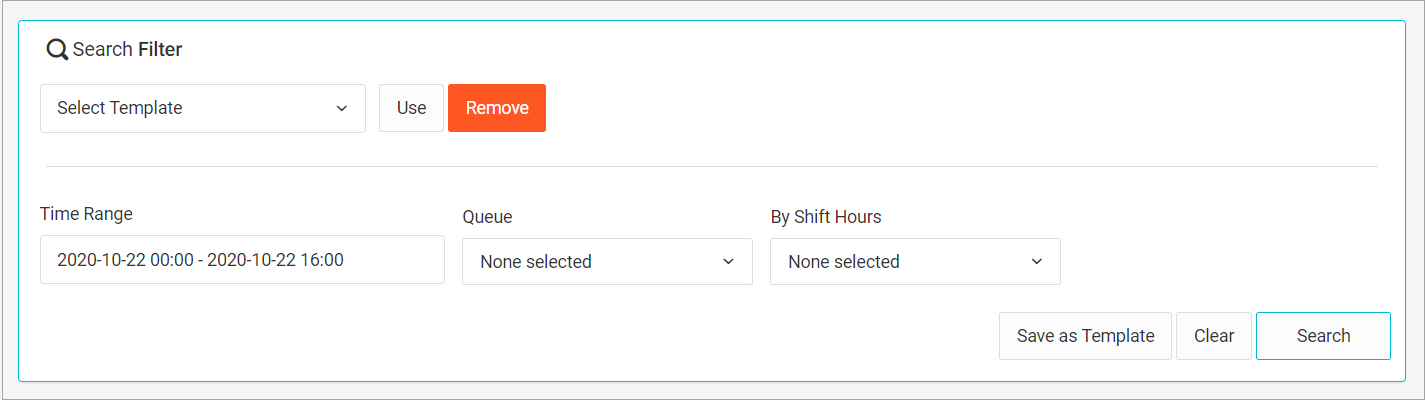
Search Filter section
a. Select the reporting period in the Time Range field. You can either use predefined options in the menu or set the custom date and time range. Finally, click Apply.
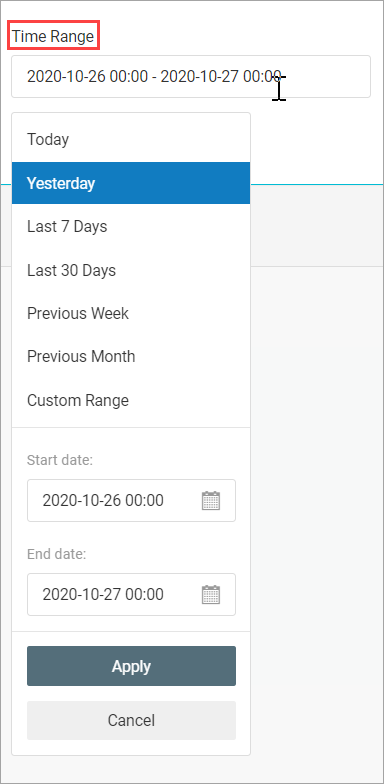
Time Range field
b. Select one or more available queues on the list.
c. Select shift hours.
-
Optionally, save selected settings as a template to run the report with the same filters at any time again. If you already have any previously saved templates, select them in the menu. Also, check the information on how to schedule reports.
-
Click Search.
NOTEPlease specify all search values, otherwise, the report will show data for a time range set by default and include all queues and shifts.
To save or print the report, click the floppy disc icon and select the option you need.
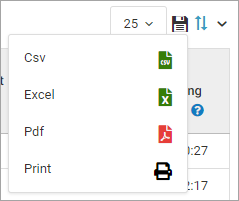
Saving options selection
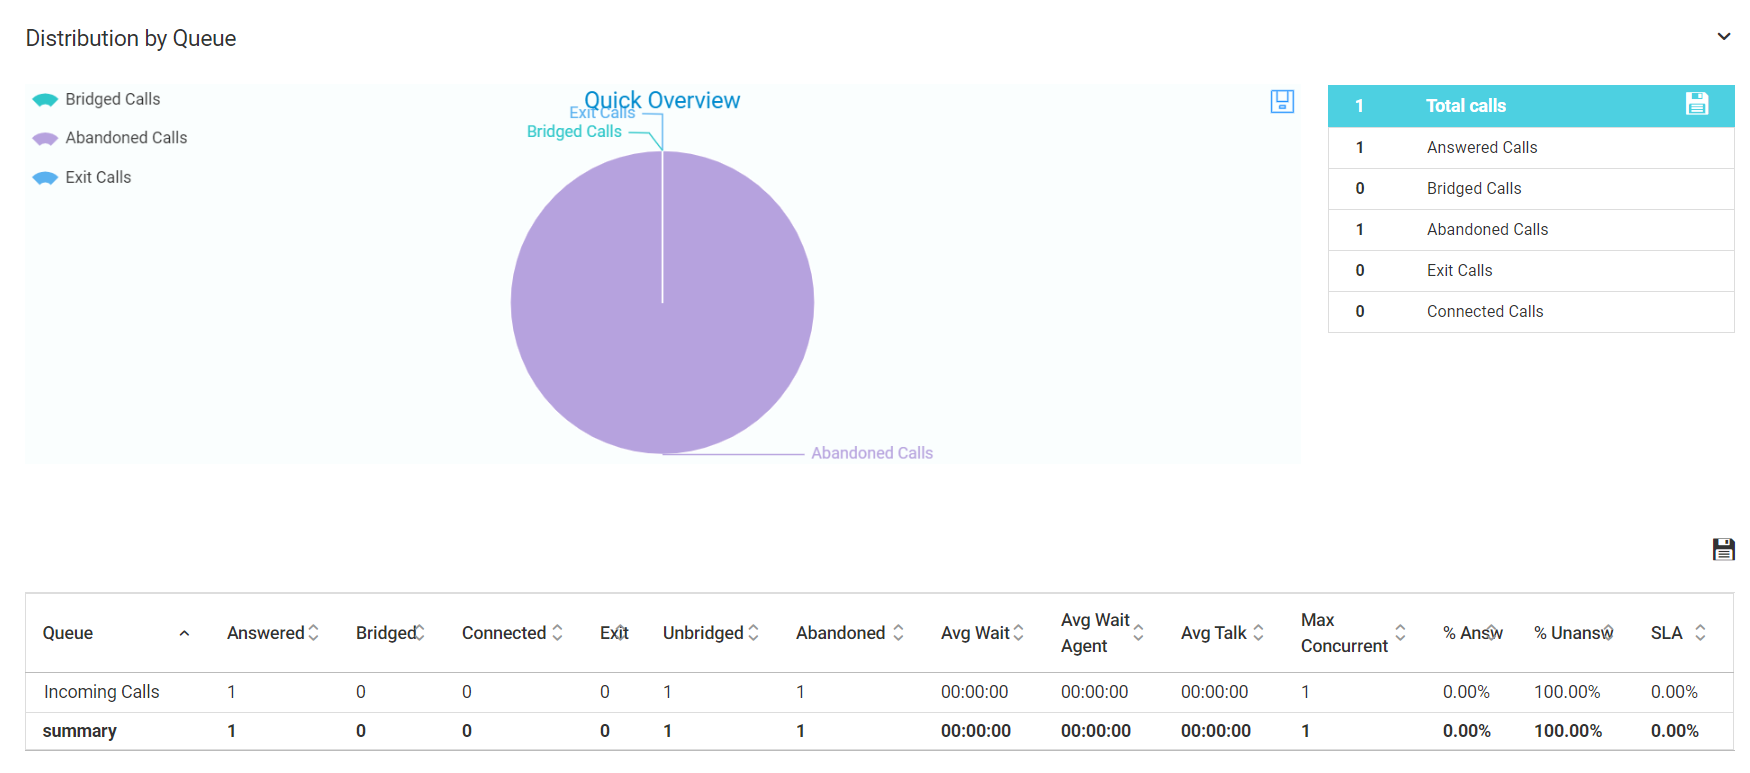
You can see the quick distribution by queue overview as well as detailed information on call types, average talk time, and other figures and percentages.
Column | Explanation |
|---|---|
Queue | The queue that the call belongs to |
Answered | The number of calls received by the agent |
Bridged | The number of calls connected to an agent ( bridged calls) |
Connected | The number of all connected calls (to an agent, Voicemailor any other way) |
Exit | The number of calls where callers left the queue in the middle of waiting |
Unbridged | The number of calls that were not connected to an agent |
Abandoned | The number of calls where the caller has abandoned his position in the queue |
Average Wait | The caller's waiting time till the exit from the queue (can be done by voicemail, hangupcall, etc.) |
Average Wait Agent | The caller’s waiting time till the bridge with the agent |
Average Talk Time | The average time the agent spent talking in outgoing calls within the selected timeframe |
Max Concurrent | The maximum amount of callers who were waiting in the queue |
Answered | The percentage of calls received by the agent |
Unanswered | The percentage of calls missed by the agent |
| SLA | Service Level Agreement is the commitment between a service provider and a client. The SLA service measured in percentage refers to calls answered within the service level time frame. The default time frame is 60 seconds (one minute). For example, the 25% SLA means a single call out of four calls in the inbound queue was answered within one minute. |
Updated 9 days ago