Shift Performance Stats
Overview agent performance during a selected timeframe, including call totals and statuses. The report breaks down calls per agent, summarizes call activity, and categorizes call statuses, offering insights into key metrics such as call duration, average call duration, and success rates.
This report gives an overview of agents’ performance during the selected timeframe (preferably after the shift ends). It includes a summary of calls displayed per agent, call totals for the whole period, and call totals grouped by status.
To run the report:
-
Expand the Reports tab and click Shift Performance Stats.
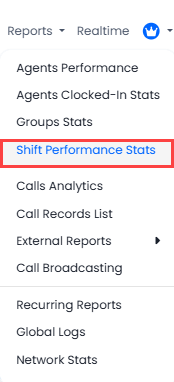
Shift Performance Stats in the Reports menu
-
Set the necessary parameters under Search Params to filter the report output.
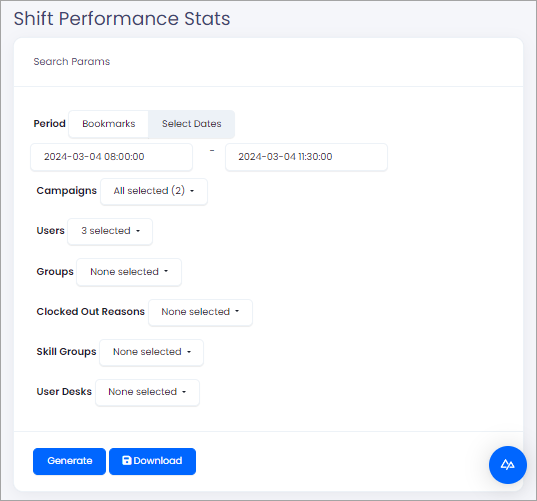
Report filters
- In the Period field, specify the date and time range for the report. On the Dates tab, select the starting and ending date and time. Alternatively, on the Bookmarks tab, choose one of the specified ranges in the dropdown list.
Filling out this field is mandatory. - In the Campaigns, Users, Groups, Clocked Out Reasons, skill groups, and Userdesks fields, select one or more values to filter the report output.
If you don’t apply any filters, the system will provide all the available output for the selected time range.
- In the Period field, specify the date and time range for the report. On the Dates tab, select the starting and ending date and time. Alternatively, on the Bookmarks tab, choose one of the specified ranges in the dropdown list.
-
Click Generate to see the results on the screen or Download to download the report in the CSV or EXCEL formats.
The output consists of three parts.
1. User Summaries
Here, you can see the breakdown of the calls per agent during the selected timeframe.
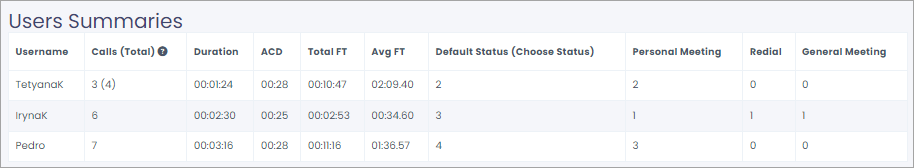
User Summaries section
Column | Description |
|---|---|
Calls (total) | The total number of calls made by the agent |
Duration | The total duration of the calls |
| ACD | The average call duration for the agent |
Total FT | The total amount of time the agent spent on the Feedback page |
Avg FT | The average time the agent spent on the Feedback page |
Statuses (General Meeting, Voicemail, etc.) | The columns show the number of times the agent specified each status. |
2. Calls Summary
This part of the report presents an overview of the selected period regarding calls.
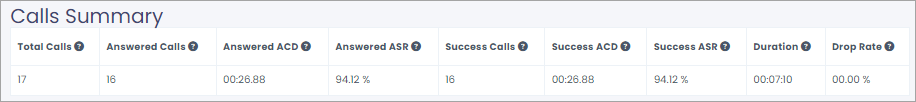
Calls Summary section
Column | Description |
|---|---|
Total Calls | The total number of calls made within the specified timeframe |
Answered Calls | All calls answered by leads, including calls not bridged to agents (AMD detect machine, leads reject the call, etc.) |
Answered ACD | Average Call Duration for answered calls |
Answered ASR | Answer Seizure Ratio for answered calls |
Success Calls | The total number of successful calls ( bridged calls to agents) |
Success ACD | Average Call Duration for successful calls |
Success ASR | Answer Seizure Ratio for successful calls |
Duration | The total duration of all the calls |
| Drop Rate | The percentage of calls dropped by the selected agents due to no available agent to receive a call, as a proportion to successful calls |
3. Statuses Summary
The section provides a summary of all statuses specified by all included agents during the timeframe.
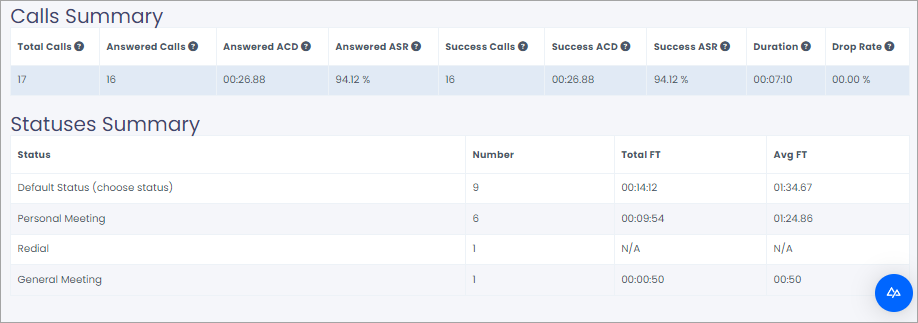
Statuses Summary section
It has the following columns:
- Status - includes all the statuses assigned to calls during the shift.
- Number - shows the number of calls with the respective statuses during the shift.
- Total FT- displays the total time spent on feedback for each status during the shift.
- Avg FT- shows the average time spent on feedback for each status during the shift.
Updated 9 days ago